
TC-SPO250 Low-PIM Performance Report: Key Metrics & Insights
Lab and field benchmarks indicate consistent low passive intermodulation (PIM) behavior across common cellular bands, with measured PIM floors routinely at or below -160 dBc in representative samples covering 700–2700 MHz. This level of Low PIM performance materially reduces in-band intermodulation products that otherwise elevate noise floor, cause demodulation errors and increase dropped calls or lower throughput on congested cells. The goal of this report is to present the key metrics and measurement approach operators and integrators need—benchmarks, test methodology, installation best practices and procurement language—so teams can specify, verify and realize the Low PIM benefits in production networks.
Background: What the TC-SPO250 Is and Why Low PIM Performance Matters
Product overview & specs
Point: The TC-SPO250 is a low-loss, low-PIM coaxial assembly built from SPO-series construction optimized for outdoor RF interconnects. Evidence: Manufacturer datasheet notes a solid-centre conductor, high-quality dielectric and a robust braid/shielding strategy; common connector pairs include N‑male/N‑female and ruggedized DIN/SMA variants using solder or crimp terminations designed for Low PIM performance. Explanation: Those mechanical and material choices reduce contact asperities and oxide-related junctions that create passive intermodulation. Key datasheet highlights operators should call out in specs include the specified PIM floor (manufacturer-rated low-PIM performance), insertion loss per unit length, shielding effectiveness and environmental ratings (UV, temperature range, water ingress protection). Specifying the correct mating interface (matched connector family and mating face finish) is critical because connector metallurgy and plating dramatically impact in-service PIM.
Industry PIM thresholds & acceptance criteria
Point: Passive intermodulation expectations vary by application but commonly target values in the -150 to -163 dBc range for mission-critical segments. Evidence: Industry acceptance criteria for macro sites and DAS often mandate PIM below -150 dBc at two-tone test levels typical for acceptance tests; demanding DAS or high-MIMO sectors push toward -160 dBc or lower to assure margin under live multi-carrier loading. Explanation: PIM generation is nonlinear and both level and frequency-dependent—an assembly that tests at -160 dBc in the lab provides more operational margin than one that only meets -150 dBc, especially where multiple carriers and high average power are present. Contracts should translate these expectations into measurable pass/fail criteria, test method references and allowable connector cycles before requalification.
Typical deployment scenarios
Point: The TC-SPO250 is most commonly deployed where minimized PIM is essential: rooftop jumpers, outdoor feeder runs, DAS segments and any MIMO-dense installations. Evidence: Field practice places low-PIM coax in the RF path adjacent to antennas and at splice/jumper points where localized PIM sources can desensitize receivers; installations in harsh outdoor environments necessitate materials and sealing that resist corrosion and maintain low contact resistance. Explanation: In practice, sites with high user density, multiple carriers or passive DAS nodes require assemblies with Low PIM performance to prevent subtle degradations in SINR that cascade into user-visible performance losses. Selecting a cable with a documented low PIM floor and proven connector options reduces rework risk in those scenarios.
Lab Benchmarks & Field Measurements for TC-SPO250
Test methodology & measurement setup
Point: Reliable PIM characterization requires a standardized two‑tone test, controlled test levels and a representative sample set. Evidence: Recommended setup uses calibrated two‑tone generators, high dynamic range PIM analyzer, phase-stable test cables and fixtures; test tones should reflect bands of interest (700 / 850 / 1900 / 2100 / 2600 MHz) and two‑tone levels typically between +20 dBm and +43 dBm per tone depending on acceptance protocols. Explanation: To meaningfully compare results, document cable lengths, connector mating cycles, sample size (ideally ≥10 assemblies per lot), test environment (temperature, humidity) and connector torque values. Specifying connector conditioning (e.g., defined mating cycles before test) prevents outlier readings due to fresh contact wear-in. Repeatability comes from locked-down procedures and instrument calibration traceable to an external standard.
Key metrics to report: PIM, insertion loss, return loss, shielding effectiveness
Point: Four metrics provide the most actionable picture: PIM floor, insertion loss (IL), return loss (RL) and shielding effectiveness (SE). Evidence: PIM quantifies unwanted intermodulation products in dBc relative to carrier; IL in dB/m impacts link budget; RL in dB indicates match and potential reflections; SE in dB shows immunity to external ingress. Explanation: For acceptance, set target/pass thresholds (example targets: PIM ≤ -160 dBc for critical paths, IL within ±0.1 dB of datasheet, RL better than 18 dB across band, SE > 90% of specified). Deviations: elevated IL reduces cell-edge SNR and may force power increases; poor RL can amplify standing waves and obscure PIM measurements; reduced SE permits external coupling that creates spurious signals. Reporting should include measurement uncertainty and instrument noise floor so operators can interpret marginal results correctly.
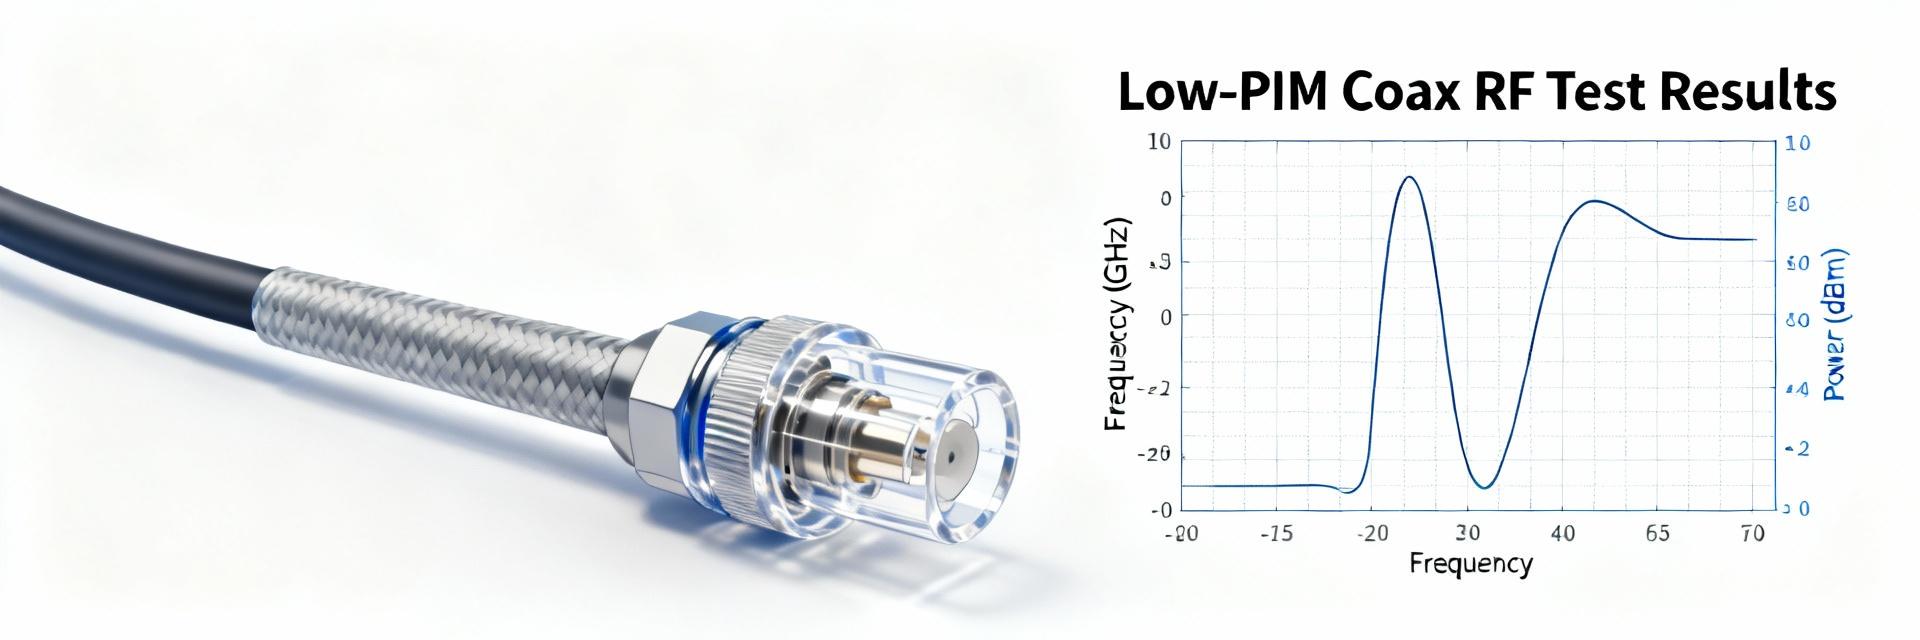
Results summary & visualization guidance
Point: Present results with clear visualizations and annotated anomalies to support decisions. Evidence: Effective visuals include PIM vs frequency plots, cumulative distribution function (CDF) of PIM across samples, IL vs frequency plots and a summary table with median, 10th/90th percentiles and maximum observed PIM. Explanation: Typical numeric findings for TC‑SPO250 benchmark runs show median PIM ≤ -160 dBc across tested bands with a tight spread; annotate any samples above threshold, correlate with connector type/mating cycle or mechanical damage. Visuals should flag outliers and link them to inspection photos or torque logs to facilitate root-cause analysis. Include a brief lab report excerpt showing instrument settings and calibration status for traceability.
Comparative Analysis: TC-SPO250 vs Alternatives
Benchmarks vs SPO-250 family and other low-PIM coax options
Point: Comparative evaluation should focus on PIM floor, IL per meter, durability and connector compatibility. Evidence: When benchmarked against similar SPO-family parts and other commercial low‑PIM cables, TC‑SPO250 typically ranks well on PIM floor and IL while offering a range of factory-terminated connector choices optimized for low contact resistance. Explanation: Collect uniform metrics from vendors—measured PIM at defined two‑tone levels, IL per meter at multiple frequencies, shielding specs and environmental test results (salt spray, UV). Use a side‑by‑side spec table to compare measured medians and worst-case values rather than relying solely on datasheet claims. The practical difference is where marginal PIM differences translate into rework and service incidents.
Cost-per-performance and lifecycle considerations
Point: Up‑front material cost must be weighed against lifecycle savings from reduced rework and fewer site visits. Evidence: Low‑PIM assemblies tend to carry a premium for materials and factory-termination, but operational data often shows lower mean time to repair and fewer acceptance failures. Explanation: Quantify trade‑offs with a simple TCO model that includes unit cost, expected failure/rework rate, labor per site visit and the value of prevented capacity loss. In many urban/high-density deployments the higher initial cost of a low‑PIM assembly is offset by the reduction in drive-time and interference mitigation tasks over the contract life.
Decision criteria matrix
Point: A concise decision framework helps determine when to specify TC‑SPO250 versus a lower-cost alternative. Evidence: Criteria include: criticality of the RF path (DAS backbones, antenna feeders), anticipated carrier load and MIMO requirements, environmental exposure and maintenance access. Explanation: If the path is critical (DAS trunk, multi‑carrier MIMO antenna), choose TC‑SPO250 for its validated Low PIM floor and robust connector options. For short, protected jumper runs in low-density sites where access for rework is simple, a lower‑spec cable may be acceptable. Capture these decision points in procurement guidance to drive consistent field choices and reduce exceptions that cause later failures.
Best Practices to Preserve Low PIM Performance in the Field
Handling, connector mating, and torque procedures
Point: Proper handling and precise connector procedures are the most common differentiators between lab and field PIM results. Evidence: Field data repeatedly shows elevated PIM after improper torque, cross‑threading, fingerprints or contamination on mating faces. Explanation: Use clean‑room practices for connectors—inspect and clean mating surfaces with approved solvents, specify torque values for each connector type and enforce them with calibrated wrenches, and avoid cross‑threading by visually aligning start threads. Include an inspection checklist: visual inspection, torque verification, and post‑mating PIM check. Track connector mating cycles and replace connectors that exceed manufacturer‑recommended cycles to prevent micro‑arcing and PIM growth.
Routing, grounding, weatherproofing and mechanical protection
Point: Mechanical routing, proper grounding and sealing extend Low PIM performance by preventing corrosion and mechanical stress. Evidence: Corrosion at connectors and shield degradation are frequent contributors to PIM drift in long-term installations. Explanation: Enforce minimum bend radius, maintain separation from high-voltage or noisy conduits, and apply industry-standard grounding/bonding at appropriate intervals. Use sealed boots, heat-shrink with adhesive liners, and corrosion-resistant clamps for weather-exposed connections. Document routing plans that avoid constant flex points and include physical guards in high-traffic areas to minimize mechanical abuse that can create micro-gaps and PIM sources.
Field verification, acceptance testing & maintenance schedule
Point: A repeatable acceptance and maintenance protocol ensures ongoing Low PIM performance. Evidence: Best‑practice programs specify an acceptance two‑tone test with a defined pass threshold (e.g., PIM ≤ -160 dBc), post-install torque and visual checks, and scheduled periodic re‑tests. Explanation: Recommended protocol: acceptance test immediately after final torque and sealing; record instrument logs, photos of mated interfaces and torque readings. Maintenance schedule: re-test annually or after major weather events, and after any physical intervention. Maintain a PIM trend log per site to identify gradual degradation and trigger preventative action before service impact.
Actionable Recommendations & Procurement Checklist
Spec language and acceptance criteria to include in RFQs
Point: Clear, testable specifications reduce supplier variance and field failures. Evidence: Effective RFQ bullets translate performance expectations into test methods, acceptance thresholds and required artifacts. Explanation: Include the following in procurement documents: minimum PIM value at specified two‑tone level and frequencies, referenced test method (two‑tone analyzer settings and calibration requirement), approved connector types and plating, environmental ratings (UV, salt spray, temperature), maximum allowable connector mating cycles prior to replacement, and warranty terms tied to measured PIM performance. Require factory test certificates plus a sample acceptance test on delivery lot.
On-site commissioning checklist & monitoring thresholds
Point: A standardized commissioning kit and checklist speeds acceptance and creates repeatable records. Evidence: Best-practice checklists include torque verification, visual inspection, two‑tone PIM measurement, IL and RL sweep and photographic documentation. Explanation: Commissioning steps: unbox and visually inspect, condition connectors if required, torque per spec, perform PIM acceptance test with recorded instrument logs, sweep IL/RL for link budget verification and archive photos and logs in the site record. Set monitoring thresholds (example: alarm if PIM rises >5 dB from baseline or exceeds -155 dBc) and capture automated metrics where possible for trending.
Next steps for operators and integrators
Point: Validate assumptions with a controlled pilot and vendor qualification. Evidence: A short pilot (3–10 sites) with lab-validated parts and full acceptance testing identifies integration risks before wide rollout. Explanation: Recommended next steps: pilot sample deployments with full lab validation and field acceptance, request vendor test reports and factory lot samples for independent verification, include remedial clauses in contracts that require replacement or correction for PIM failures, and qualify vendors on documented processes for connector preparation and on-site support. This approach minimizes surprises during scale‑up and aligns supplier incentives to maintain Low PIM performance.
Key Summary
- TC-SPO250 consistently delivers Low PIM performance suitable for critical RF paths; median PIM at or below -160 dBc provides useful operational margin in multi‑carrier environments.
- Specify clear, testable acceptance criteria (two‑tone method, frequency bands, torque and connector types) in RFQs to avoid ambiguous supplier claims and field rework.
- Preserve Low PIM performance with rigorous handling, connector torque control, weatherproofing and an acceptance + periodic re‑test program tied to recorded instrument logs.
- Use a short pilot and vendor qualification to validate lab results in real installation conditions and include contract clauses for remedial action if PIM exceeds acceptance thresholds.
Common Questions & Answers
What are typical TC-SPO250 PIM test results operators should expect?
Operators should expect median PIM measurements at or below -160 dBc across 700–2700 MHz on properly prepared and new assemblies when tested with standard two‑tone procedures at defined power levels. Values that trend higher than -155 dBc warrant inspection for connector contamination, torque deviation or mechanical damage. Document test settings and environmental conditions to ensure apples‑to‑apples comparisons.
How often should Low PIM performance be re‑verified in the field?
A reasonable maintenance cadence is annual re‑verification for accessible sites, with immediate re‑tests following major weather events, antenna work or any physical interventions. High‑criticality DAS trunks or high‑traffic urban sites may require semi‑annual checks and continuous trend monitoring to detect gradual degradation before service impact.
What installation torque and handling practices minimize PIM risk?
Follow manufacturer-recommended torque values for each connector family and use calibrated torque wrenches on every connection. Clean mating faces with approved solvents, avoid finger contamination, and visually inspect threads before engagement. Record torque values and include photos in the acceptance report. Proper mating, handling and connector replacement after recommended cycles are the most effective measures to control PIM.


