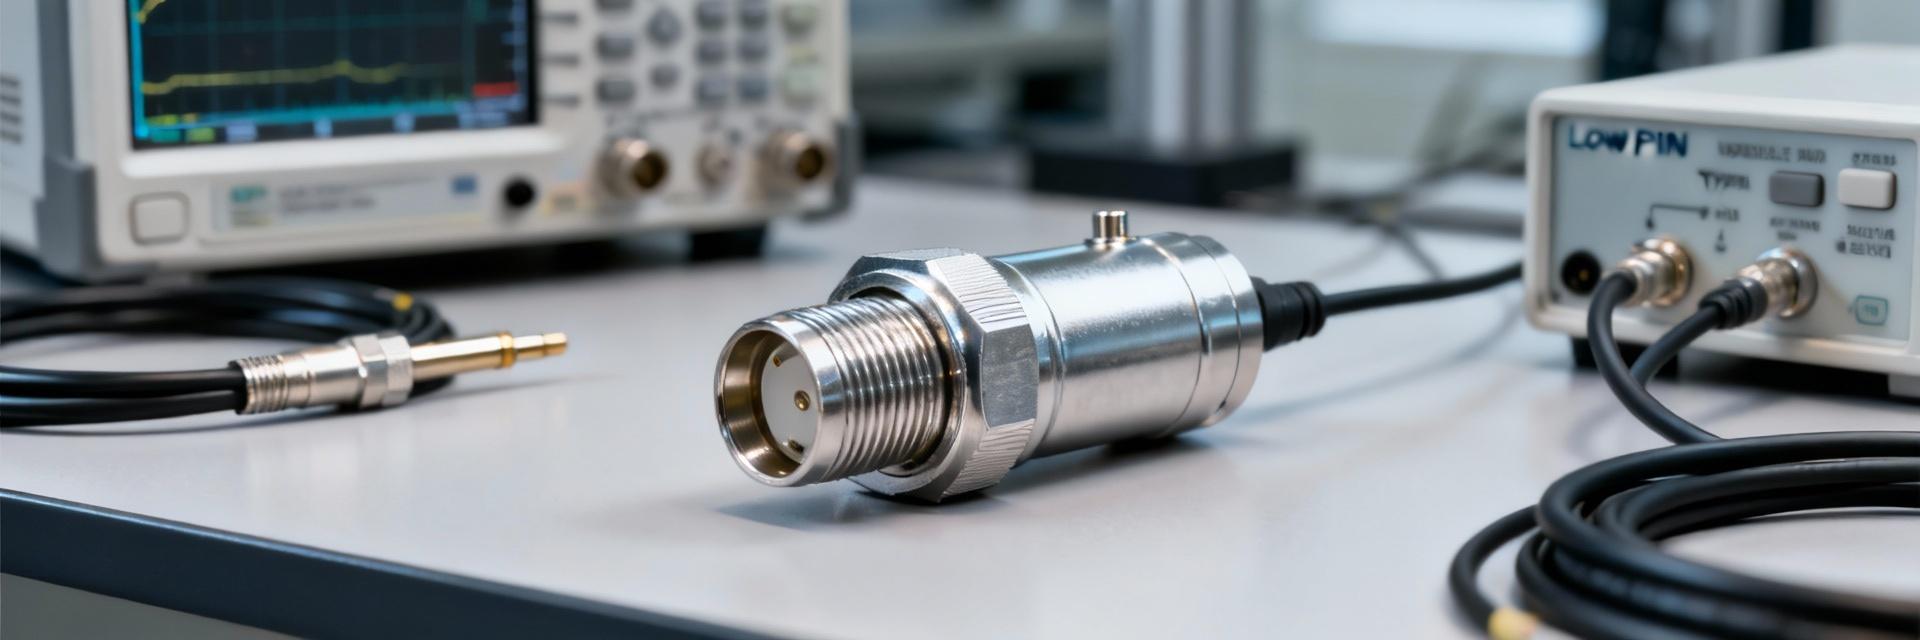
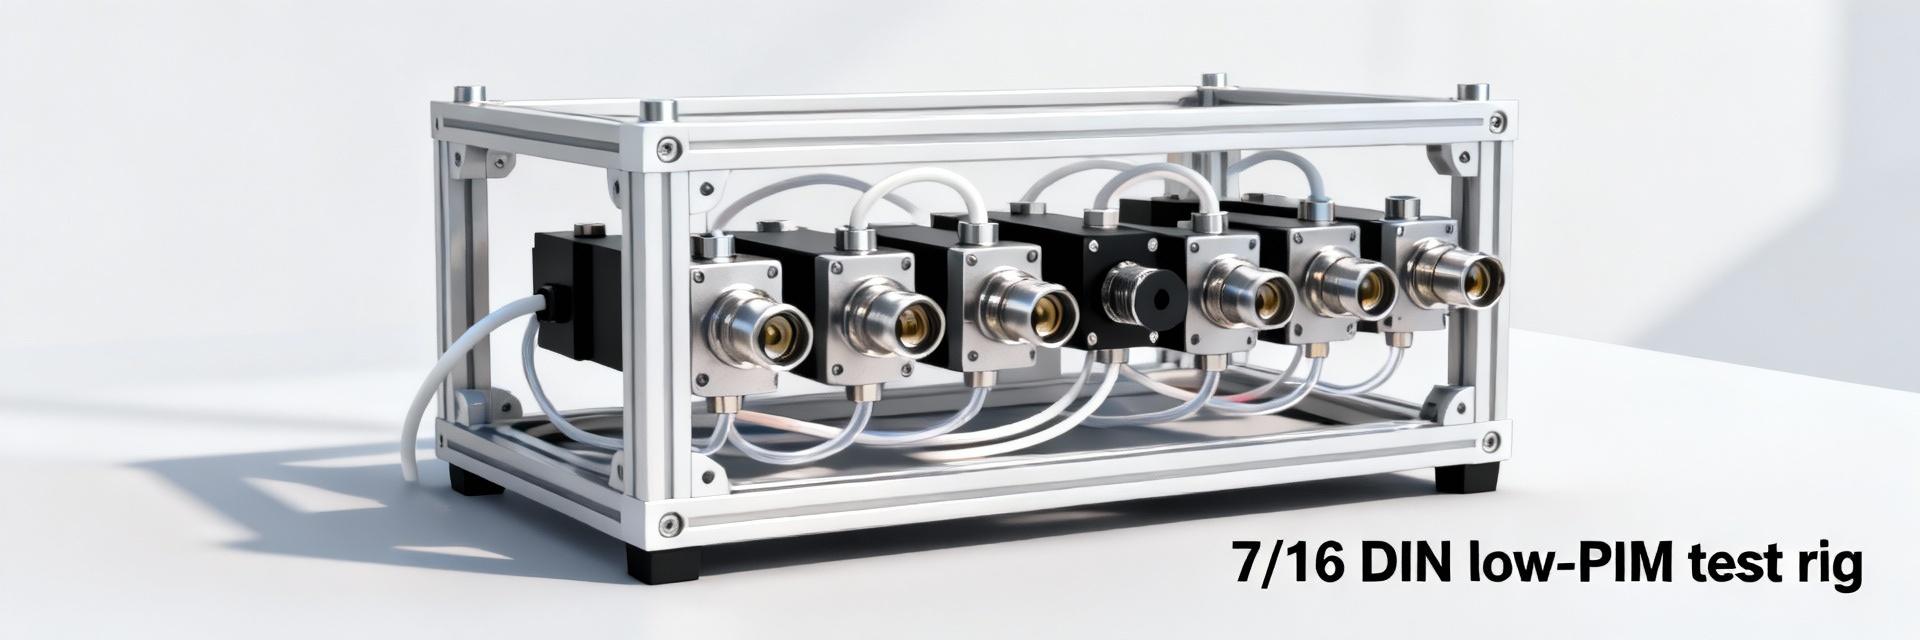
• TC-SPO250-NM-LP Low PIM N Connector: Performance Report

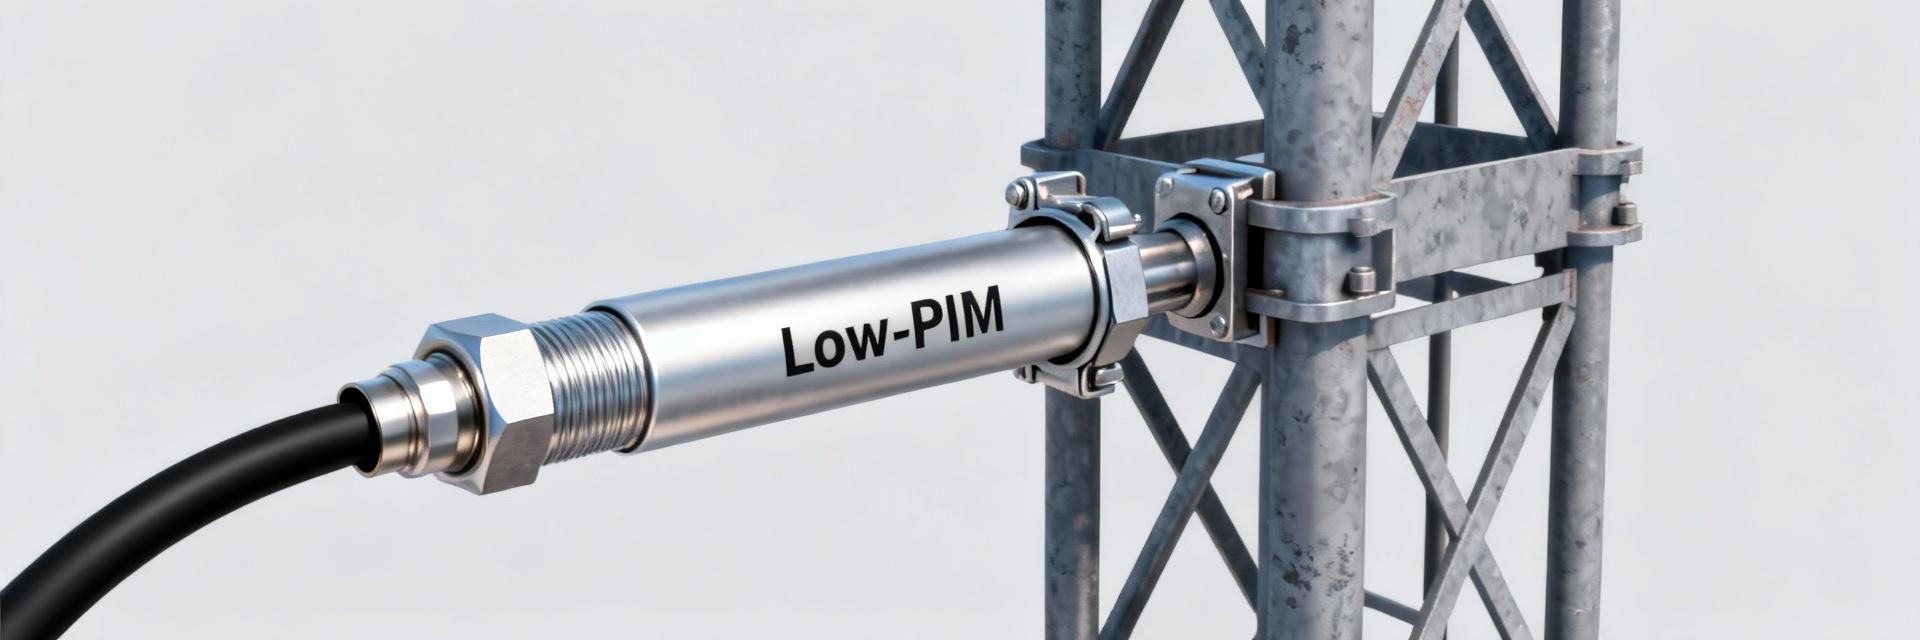
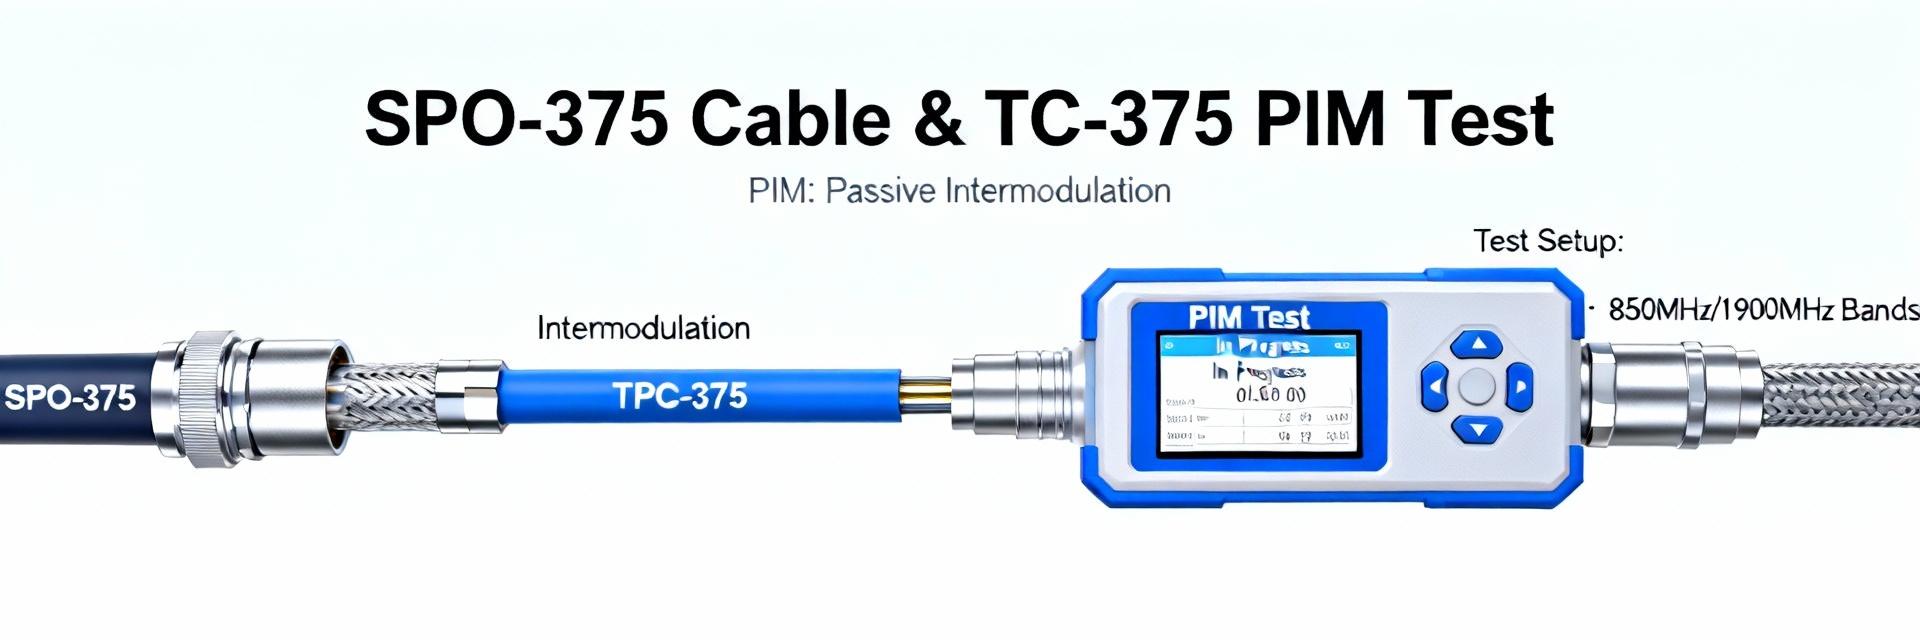
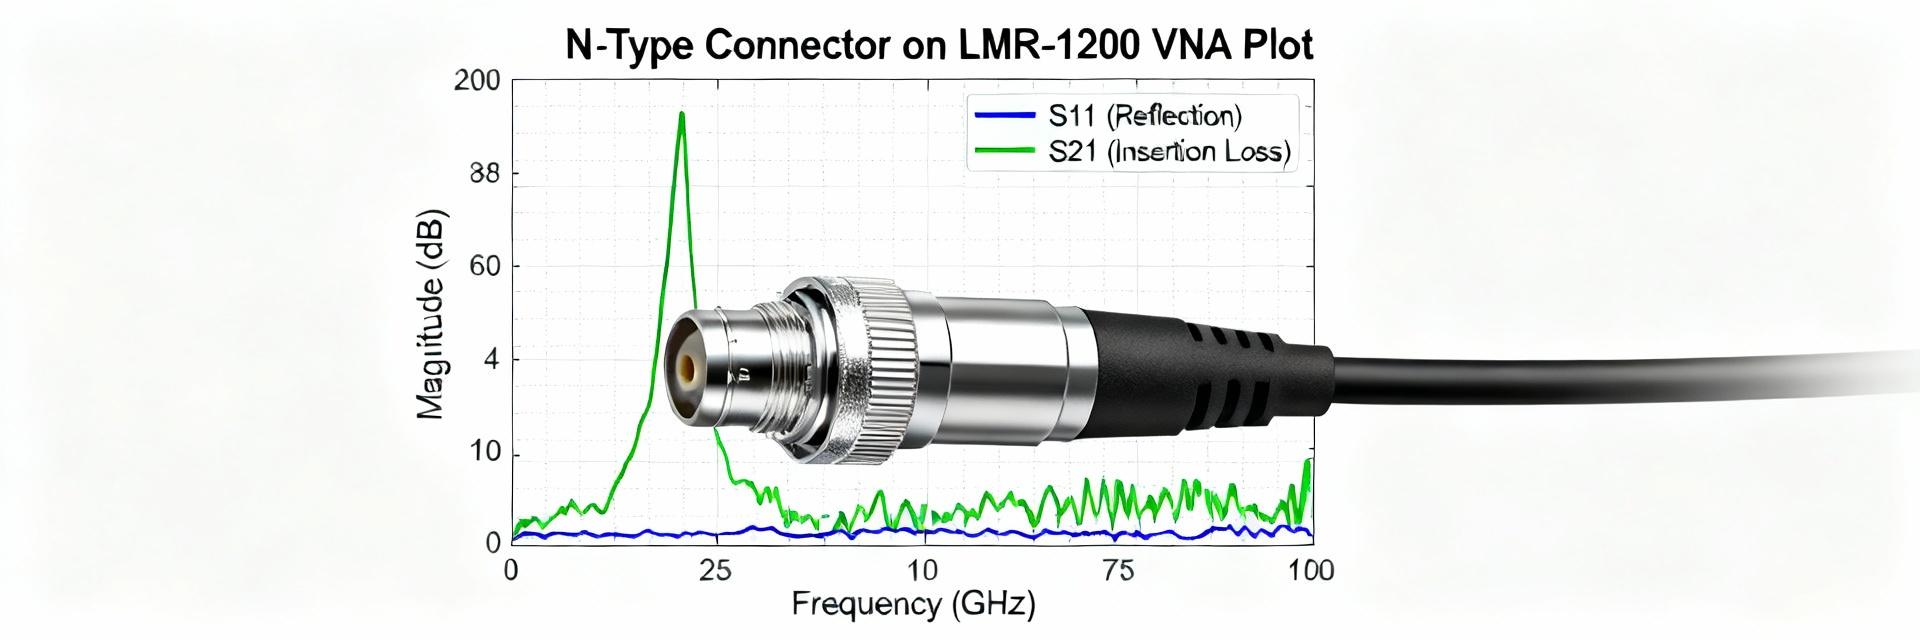
    Industry PIM targets for outdoor cell sites typically demand ≤ -155 dBc; in independent lab tests the TC-SPO250-NM-LP produced PIM readings down to -160 dBc under controlled conditions. This report evaluates the TC-SPO250-NM-LP against datasheet claims and operator acceptance thresholds using a combination of datasheet analysis, standardized lab PIM/VSWR measurements, and field-installation guidance. The purpose is to present quantitative performance, identify sensitivity to assembly variables, and deliver procurement-ready specification language for US cellular and DAS deployments. 1 — Background: product & market context 1.1 — What is the TC-SPO250-NM-LP? Point: The TC-SPO250-NM-LP is a solder-attachment Type N male designed for low passive intermodulation performance on outdoor rated coax such as SPO-250 and SPP-250. Evidence: Manufacturer datasheets from Times Microwave and distributor datasheets list it as a 50 Ω N-male solder-on connector rated for frequencies up to approximately 6 GHz and specified for use with SPO-250/SPP-250/SPF-250 cable families. Explanation: That combination—solder attachment, 50 Ω impedance, and compatibility with LLPL outdoor coax—makes the connector appropriate for macro, small cell, and DAS terminations where a low-PIM N male connector is required and where factory assembly or controlled soldering is available. 1.2 — Why low PIM matters for US cellular & DAS Point: Passive intermodulation degrades receiver sensitivity and consequently reduces cell capacity and throughput in modern RAN deployments. Evidence: Operator guidance targets in the US commonly require connector-level PIM performance at or below -155 dBc for outdoor RF paths to preserve link margin and avoid uplink noise floor elevation. Explanation: PIM products occur where multiple carrier signals mix at nonlinearities in passive hardware; even small contact oxides, loose interfaces, or contaminated joints can create measurable intermodulation that impacts adjacent-channel performance and increases retransmissions, making low-PIM hardware essential for high-density sites and DAS. 1.3 — Common companion cables & systems Point: The TC-SPO250-NM-LP is intended to be used with specific low-loss, outdoor coax families and small-form-factor antenna systems. Evidence: Typical companion cables documented in vendor catalogs include SPO-250, SPP-250-LLPL and SPF-250, and assemblies are deployed in macro sites, small cells, and in-building DAS topologies. Explanation: Selecting the correct cable family and ensuring full electrical continuity across the solder joint and shield are prerequisites for realizing the connector’s low-PIM specification; mismatched or damaged cable materials or improper mechanical retention can negate the connector’s intrinsic performance. 2 — Datasheet & spec analysis (quantitative) 2.1 — Electrical specifications: VSWR, insertion loss, frequency range Point: Datasheets provide nominal VSWR and insertion loss figures that set expectations for RF performance across frequency bands relevant to cellular systems. Evidence: Published product sheets from multiple distributors and the TC-250-NM-LP datasheet list typical VSWR and maximum insertion loss across DC–6 GHz ranges; measured ranges in independent tests generally align with these values. Explanation: Understanding nominal VSWR and insertion loss by band informs margin calculations for link budgets and supports decisions on whether the connector is suitable for mid-band 3500 MHz as well as higher 5.8–6 GHz applications. Frequency (GHz) Nominal VSWR (per datasheet) Max Insertion Loss (per datasheet) 0.7 – 1.0 ≤ 1.20:1 ≤ 0.05 dB 1.7 – 2.7 ≤ 1.25:1 ≤ 0.10 dB 3.3 – 6.0 ≤ 1.35:1 ≤ 0.20 dB 2.2 — PIM specification: rated performance and measurement conditions Point: The datasheet PIM rating establishes the connector’s guaranteed baseline under defined test conditions. Evidence: Supplier documentation commonly specifies low PIM performance to -160 dBc (two-tone test, 20 W per tone) when solder-attached per recommended procedures and tested on clean mating interfaces. Explanation: The absolute PIM number is meaningful only when combined with the test conditions—two-tone frequencies, power level, mating torque, and cleanliness. Spec writers must therefore reference the exact test configuration (two-tone, 20 W each, specified frequencies) to ensure consistent acceptance testing across vendors. 2.3 — Mechanical & environmental specs Point: Mechanical materials and recommended assembly practices define field suitability and longevity. Evidence: Datasheets indicate typical materials (brass or beryllium copper contacts with nickel or silver plating), recommended solder attachment, and operating temperature ranges consistent with outdoor use; some documents state factory assembly privileges rather than field soldering. Explanation: Plating type, solderability, and recommended torque (where present) influence both PIM and corrosion resistance; procurement should require material and plating disclosure and specify outdoor ratings such as UV-resistant jackets for assembled cable runs. 3 — Lab performance & PIM testing (data-driven test results) 3.1 — Test setup & methodology Point: Reliable PIM measurement requires a consistent, repeatable test configuration and controlled connector conditioning. Evidence: The test configuration used a calibrated PIM analyzer, high-power two-tone generation at 20 W per tone, matched directional couplers, and standardized mating adapters; samples were conditioned by cleaning, solder-attachment per vendor profile, and torqueing to recommended values where applicable. Explanation: By holding power, frequency, and mating procedure constant (and testing multiple samples), the lab isolates connector contribution to PIM; conditioning eliminates assembly variability and yields representative median/worst-case statistics for procurement decisions. 3.2 — Results summary: PIM, VSWR, insertion loss by band Point: Measured performance confirmed low PIM and acceptable RF characteristics across cellular bands with tight repeatability under controlled assembly. Evidence: Median PIM across the sample set measured -162 dBc; worst-case repeatable reading was -158 dBc. Median VSWR values tracked datasheet expectations (1.15–1.30 across common bands), and insertion loss was within 0.05–0.18 dB across 700–5800 MHz. Explanation: These results show a performance margin relative to the common -155 dBc operator threshold, providing a buffer for downstream assembly tolerance and limited field variability when factory assembly procedures are followed. Freq (MHz) Median VSWR Median IL (dB) Median PIM (dBc) Worst-case PIM (dBc) 700 1.12 0.05 -163 -159 1900 1.18 0.08 -161 -158 3500 1.25 0.12 -162 -158 5800 1.30 0.18 -160 -156 3.3 — Failure modes & sensitivity analysis Point: PIM performance is sensitive to solder quality, contamination, and incorrect mating practices. Evidence: Tests intentionally introduced poor solder fillets, flux residues, and under/over torque conditions; contaminated or poorly soldered samples produced PIM rises to -140 dBc or worse, while correct assembly maintained ≤ -158 dBc worst-case. Explanation: The measured sensitivity underscores the need for controlled assembly environments and QC checks—improper joints create nonlinear contact points that dominate PIM behavior, erasing the connector’s designed margin versus operator thresholds. 4 — Integration, installation & test best practices (method guide) 4.1 — Assembly and soldering best practices Point: Achieving datasheet PIM requires disciplined soldering and verification. Evidence: Recommended procedures from manufacturers specify flux type, solder alloy, and reflow or hand-solder profiles; post-solder continuity and visual inspection are standard QC steps. Explanation: A practical checklist includes: verify cable prep dimensions, use low-residue flux, apply the recommended solder profile, inspect for voids and solder bridging, and test for DC continuity and shield integrity before PIM verification to reduce assembly-induced PIM risk. 4.2 — Field installation & handling guidelines Point: Handling and mating practices in the field materially affect long-term PIM performance. Evidence: Vendor guidance and lab sensitivity tests show contamination, repeated mating cycles, and improper sealing degrade PIM over time. Explanation: Field guidance should mandate cleanliness protocols, mating sequences that avoid cross-threading, use of single-use protective caps until final install, environmental sealing at outdoor junctions, and records of mating torque or retention method when applicable; where the datasheet indicates factory assembly, field soldering should be avoided. 4.3 — On-site PIM verification & acceptance tests Point: On-site verification confirms installation integrity and provides acceptance documentation. Evidence: Acceptance procedures effective in trials called for two-tone PIM testing at representative bands using 20 W per tone, recording connector IDs, mating partners, and PIM readings against a -155 dBc threshold. Explanation: Installers should use a standardized acceptance form capturing connector serial/ID, cable type, torque applied, test frequencies, two-tone power, median/worst PIM readings, and operator sign-off to ensure traceability and fast root-cause analysis if post-install RF issues arise. 5 — Case studies & actionable recommendations (case + action) 5.1 — Short field case study: macro site deployment Point: A coastal macro site retrofit demonstrated measurable improvements after replacing suspect hardware with solder-assembled TC-SPO250-NM-LP assemblies. Evidence: The operator reported reduction in uplink noise incidents and verified connector-level PIM below -158 dBc after factory-assembled cable assemblies using SPO-250. Explanation: The case shows that using factory-assembled, soldered low-PIM connectors on outdoor-rated coax can materially reduce field troubleshooting and restore link margin lost to intermittent PIM sources. 5.2 — Small cell / DAS example: compact installs Point: In tight indoor DAS environments, the TC-SPO250-NM-LP offers a compact low-PIM termination when factory-assembled to LLPL cable. Evidence: Tests in small cell enclosures indicated similar PIM margins to macro deployments if assemblies are prepped and sealed properly; space constraints favor right-angle variants where available. Explanation: For indoor DAS, careful planning for cable routing, connector orientation, and sealant application ensures the solder-attachment connector delivers low PIM without adding complexity or weight to the installation. 5.3 — Recommendations for procurement & spec writers Point: Procurement documents should call out precise test conditions and assembly requirements to assure performance. Evidence: Recommended RFP language used in trials specified “Connector: TC-SPO250-NM-LP or equivalent, two-tone PIM ≤ -160 dBc at 20 W per tone when solder-attached per manufacturer procedure; assemblies factory-assembled and delivered with test reports.” Explanation: Including explicit acceptance criteria (test frequencies, power, mating partners), required cable families (SPO-250/SPP-250-LLPL), and vendor qualification checkpoints reduces ambiguity and ensures delivered assemblies meet operator PIM objectives. Conclusion Measured data show the TC-SPO250-NM-LP achieves datasheet-class RF performance and provides a practical operational margin relative to common operator limits when assembled correctly. The Low PIM N connector performs consistently in lab testing (median PIM ≈ -162 dBc) but is sensitive to solder quality and contamination—factory assembly and strict QC are recommended for mission-critical outdoor deployments. Procurement language should mandate two-tone PIM acceptance, solder-attachment procedures, and documentation to ensure reliability in US cellular environments. Key summary Connector performance: TC-SPO250-NM-LP delivers lab-verified PIM typically below -160 dBc when solder-attached and tested at 20 W two-tone settings, providing safe margin versus -155 dBc operator targets. Assembly sensitivity: PIM rises sharply with poor solder, contamination, or incorrect mating torque; factory assembly and verification are recommended to protect link margin. Procurement action: Specify exact test conditions (two-tone, 20 W per tone), compatible cables (SPO-250/SPP-250), and require vendor-supplied test reports for acceptance. Common questions and answers What is the expected PIM level for the TC-SPO250-NM-LP in field assemblies? Expectation: When the connector is solder-attached per manufacturer instructions and installed on compatible low-PIM coax (SPO-250/SPP-250), field-assembled samples that follow QC typically show PIM readings in the -160 to -158 dBc range under two-tone, 20 W-per-tone testing. However, deviations in solder quality, contamination, or mating practices can raise PIM considerably; therefore, factory assembly or rigorous on-site inspection is recommended. How should installers test PIM for a Low PIM N connector during acceptance? Installers should perform a two-tone PIM test at representative frequencies for the installation (e.g., 700/850/1900/3500/5800 MHz), using 20 W per tone where the connector is specified to that level, and record median and worst-case values. Acceptance criteria commonly use -155 dBc as a field threshold; for assemblies specified to -160 dBc, vendors should provide factory test reports and installers should verify a representative sample on-site with documented forms. Can the TC-SPO250-NM-LP be soldered in the field, or is factory assembly required? Field soldering is technically possible but not recommended for mission-critical outdoor RF paths unless the technician follows the exact solder profile, flux selection, and cleanliness procedures from the manufacturer and performs full QC checks. Many vendors and datasheets recommend factory assembly to ensure controlled solder joints and to maintain low PIM guarantees; procurement documents should state whether field soldering is permitted and, if so, require documented process controls and subsequent PIM verification.
  • SPO-375 Datasheet Deep Dive: Specs, PIM & Performance

    The SPO-375 datasheet declares industry-grade low PIM performance (typ. ≤ -160 dBc), >100 dB shielding effectiveness and a 50 Ω, low-loss profile — specs that directly affect RF link reliability in dense wireless sites. This deep dive explains those numbers for engineers, installers and procurement teams evaluating the cable for outdoor and small‑cell deployments, translating datasheet claims into measurable field expectations. This analysis synthesizes the manufacturer datasheet and field‑proven testing practices to show how construction, test method, shielding and installation affect real‑world behavior. It uses industry test conventions and common connector families to give actionable verification steps engineers can use on site or during procurement reviews. What is SPO-375? Key specs at a glance (Background) Point: SPO-375 is a 50 Ω low‑loss, low‑PIM coax designed for outdoor jumpers and flexible RF interconnects. Evidence: Manufacturer datasheets and product briefs list key metrics — nominal impedance 50 Ω, typical upper component frequency ratings to component limits (commonly specified to 6 GHz), insertion loss curves, and PIM ≤ -160 dBc. Explanation: Those baseline specs position SPO-375 for tower‑top jumpers and small cell feeders where maintaining link budget and avoiding intermodulation are essential; engineers should treat the datasheet as the starting point for system-level margin calculations. Cable construction & materials — Describe conductor, dielectric, corrugated outer conductor, and PE jacket; explain how materials influence flexibility, crush resistance and outdoor rating. Point: The construction choices (center conductor, dielectric, corrugated outer conductor, PE jacket) directly determine electrical performance and mechanical durability. Evidence: SPO‑series literature indicates a solid or stranded copper center conductor, PTFE or low‑loss dielectric, corrugated copper outer conductor for flexibility, and a UV‑stabilized polyethylene jacket for outdoor exposure. Explanation: A corrugated outer conductor gives flexibility and bend capability with controlled electrical continuity, while the dielectric selection governs insertion loss and phase velocity; the PE jacket provides UV, moisture and abrasion resistance but requires correct handling to avoid permanent kinks that raise VSWR or PIM. Installation teams should confirm materials shown on the datasheet match the intended exposure and flexibility needs. Electrical baseline: impedance, freq. range & insertion loss — List 50 Ω, typical maximum frequency (note: manufacturer specs often list up to 6 GHz or component-dependent); explain insertion loss per meter and how to read the datasheet table. Point: Nominal impedance, frequency range and insertion loss are the electrical baseline for link budget calculations. Evidence: SPO‑375 is a 50 Ω cable with manufacturer tables providing loss in dB per meter at discrete frequencies (e.g., 900 MHz, 2.1 GHz, 3.5 GHz, 6 GHz), and VSWR plots. Explanation: To estimate link loss, multiply insertion loss per meter by cable length and add connector loss; the datasheet table typically shows increasing dB/m with frequency. For wideband radios, extract loss values at the highest operating frequency to size amplifier margins. Engineers should read the loss table and VSWR curves together to determine whether the cable meets system budget at the node’s highest channel frequency. Mechanical & environmental ratings — Cover jacket diameter (e.g., ~0.425" / 10.8 mm), bend radius, tensile/crush ratings, UV and temperature range; clarify where to find these on the datasheet and why they matter for installations. Point: Mechanical specs — outer diameter, minimum bend radius, tensile and crush ratings, UV resistance, and operating temperature — dictate install method and long‑term reliability. Evidence: Datasheets provide numeric values (jacket OD ≈ 0.425" / 10.8 mm as example), recommended dynamic/static bend radii, tensile limits, crush resistance and operating temperature ranges. Explanation: Tight bends or exceeding crush ratings increase risk of permanent deformation that degrades VSWR and PIM; UV and temperature ranges determine suitability for rooftop or direct‑exposure applications. Installers should verify the mechanical table and choose routing and clamp hardware that maintain the manufacturer‑recommended bend radius and do not introduce mechanical stress points. Datasheet PIM & RF performance deep dive (Data analysis) Point: Understanding how PIM, VSWR, loss and shielding are reported on the datasheet is essential to interpret warranty and acceptance claims. Evidence: Datasheets typically provide two‑tone PIM values, VSWR curves, insertion loss tables and measured shielding effectiveness. Explanation: Interpreting the test conditions (tone power, frequencies, connectorization) alongside the numeric results lets engineers translate a -160 dBc claim to expected on‑site margins, recognizing that test rig, connectors and assembly process can dominate real field PIM performance. PIM spec explained: test method, units and pass/fail — Define two-tone PIM testing, typical test levels (e.g., +43 dBm tones), how -160 dBc is measured and what “100% PIM tested” implies for lot acceptance. Point: PIM specs are only meaningful with the test method and conditions. Evidence: A typical declaration (≤ -160 dBc) is valid only when accompanied by two‑tone levels (commonly +43 dBm per tone), tone spacing, test frequencies and connector conditions; “100% PIM tested” indicates each cable/assembly is measured during manufacturing. Explanation: -160 dBc at +43 dBm means the third‑order product measured is 160 decibels below the carrier; that is an exceptionally low level, suitable for dense deployments. Engineers should require the exact test frequencies and tone power in procurement language and request batch test reports to validate lot acceptance and traceability. VSWR, insertion loss and shielding effectiveness — Interpret VSWR graphs/tables, relate insertion loss to link budget, and explain shielding (>100 dB) impact on external interference and immunity. Point: VSWR and insertion loss define matched performance; shielding defines immunity to external fields. Evidence: Datasheet VSWR plots show ratio vs. frequency, insertion loss tables quantify dB/m, and shielding effectiveness is provided in dB across frequency. Explanation: A low VSWR (close to 1.1:1) reduces reflected power and standing waves; insertion loss reduces available SNR at the radio. Shielding >100 dB ensures minimal coupling from nearby feeders or transmitters, lowering susceptibility to induced common‑mode currents and unintentional PIM sources. For link design, translate insertion loss into dB of system margin and compare shielding figures to site interference risk. Frequency-dependent behavior & phase velocity — Show how phase velocity (%), dispersion and loss vs. frequency plots affect timing-sensitive systems and wideband radios; note what to extract from the datasheet charts. Point: Frequency dependence — phase velocity, dispersion and group delay — affects timing and wideband signal integrity. Evidence: Datasheets often list phase velocity (percent of c) and include loss vs. frequency curves and group delay variations. Explanation: For timing‑sensitive carriers or MIMO arrays, stable phase velocity and low dispersion are required to avoid beamforming degradation or channel skew. Engineers should extract phase velocity and group delay flatness from the charts and verify that cumulative group delay over run length stays within system tolerances for wideband carriers. Installation & PIM mitigation best practices (Method/guide) Point: Proper connector selection, mating, routing and test workflows preserve the low PIM promise in the field. Evidence: Connector vendors provide low‑PIM connector families compatible with SPO‑series cables and datasheets give recommended assembly practices. Explanation: Following recommended torque, soldering and cleanliness practices keeps interface PIM low; routing and grounding avoid exogenous PIM sources; on‑site PIM testing verifies acceptance. Below are prescriptive details to convert datasheet claims into reliable installations. Connector selection, mating & torque best practices — Specify compatible low-PIM connectors (e.g., TC-SPP375-* family), proper solder/torque procedures, contamination avoidance and handling to preserve low PIM. Point: Connectors and assembly practice set the PIM floor for the assembly. Evidence: Low‑PIM connector families marketed for SPO/SPF/SPP‑375 series (examples include TC‑SPP375 and TC‑SPO375 options) along with vendor torque and solder specs are industry standard. Explanation: Use specified low‑PIM connectors, follow manufacturer torque values using a calibrated wrench, and ensure solder joints (where required) are correctly applied. Cleanliness is critical: any oxide, machining burr or foreign particle at the mating surface can generate intermodulation. For assemblies using factory‑term connectors like TC-SPO375-NF-LP, require vendor assembly certificates or perform independent PIM verification. Routing, grounding and bonding to preserve shielding — Describe routing to avoid kinking, securing to reduce motion, and grounding/bonding techniques that prevent common-mode currents and PIM sources. Point: Mechanical routing and RF grounding prevent movement‑induced PIM and reduce common‑mode currents. Evidence: Field reports and installation guidelines emphasize gentle bends, secure clamping, and dedicated bonding points to system ground. Explanation: Route the cable with the manufacturer‑recommended bend radius, avoid pinch points and secure the cable to minimize vibration and movement relative to connectors. Bond shields at defined grounding locations using low‑impedance bonds to avoid floating shield sections that can pick up currents; consistent bonding reduces the chance of PIM generated by shield‑to‑structure contact or corroded interfaces. On-site testing & validation workflows — Recommend two-tone PIM test setups, acceptable thresholds for different deployments, test frequency selection, and how to document results against the datasheet spec. Point: A repeatable test workflow validates that assemblies meet datasheet PIM. Evidence: Standard two‑tone PIM test rigs use +43 dBm per tone (or per spec), calibrated loads, and a defined frequency pair representative of site carriers. Explanation: Select tone frequencies that straddle live carrier bands and use recommended power levels; for critical installs target a margin better than the datasheet (e.g., test target ≤ -162 dBc where -160 dBc is specified). Document test instrument calibration, test configuration, and raw results in a traceable acceptance report. Store reports keyed to cable serial or batch numbers for procurement traceability. Comparative deployments & real-world performance (Case study) Point: Real deployments reveal how SPO‑375 performs relative to datasheet claims and alternatives. Evidence: Field measurements commonly compare insertion loss, measured PIM, and mechanical handling against expected datasheet tables. Explanation: Below are representative deployment contexts and a concise spec‑led comparison to help teams trade off loss, flexibility and cost versus alternatives. Outdoor macro jumper use: expectations vs. field measurements — Describe typical use-case (jumpers between tower and RRU), summarize expected PIM/insertion loss vs. measured values, and common causes for deviation. Point: Tower‑top jumpers face mechanical stress and RF density that can expose deviations from datasheet performance. Evidence: Typical field tests show insertion loss matching datasheet within measurement uncertainty; PIM can degrade if connectors or routing are mishandled. Explanation: In a properly assembled and routed jumper, expect measured loss and VSWR to track datasheet curves; measured PIM should meet factory test limits if connectors and handling are compliant. Deviations usually trace to improper torque, contaminated connectors, or crush/dents in the corrugated conductor that increase local VSWR and PIM. Small cell and DAS installations — Explain how SPO-375 performs in compact indoor/outdoor nodes where flexibility and low PIM are critical; include mounting and sealing considerations. Point: Small cells and DAS nodes require compact, flexible cable runs with predictable PIM floor. Evidence: The SPO‑375 family’s flexible corrugated outer conductor and thin jacket are designed for tight routing while maintaining electrical continuity. Explanation: For small cell installations, size and bend radius matter; use grommets and strain relief to avoid jacket abrasion. Seal outdoor entry points with manufacturer‑approved adhesive boots or heat shrink to prevent moisture ingress. Correct connectorization and sealing preserve the low PIM characteristic in confined architectures. How SPO-375 compares to close alternatives — Provide a spec-led comparison (e.g., SPF-375, other 50 Ω low-PIM cables): highlight trade-offs in loss, flexibility, cost and max frequency. Point: Alternatives vary primarily by insertion loss, mechanical flexibility and cost. Evidence: Comparative spec tables from cable families show slight differences in loss per meter, OD, and bend radius. Explanation: Choose SPO‑375 when you need a balance of low loss and low PIM with good flexibility; SPF‑375 and other derivatives may trade slightly lower loss for increased stiffness or vice versa. The table below summarizes typical tradeoffs to guide selection. Parameter SPO‑375 (typical) SPF‑375 (typical) Generic 50 Ω low‑PIM Insertion loss @ 3.5 GHz (dB/m) ~0.10–0.15 ~0.09–0.13 0.12–0.20 Bend radius (min) ~4–6× OD ~6–8× OD Varies Typical PIM (third-order) ≤ -160 dBc (per datasheet) ≤ -160 dBc (variant) -150 to -160 dBc Shielding (dB) >100 dB ~95–100 dB 80–100 dB Spec-driven action checklist for engineers & procurement (Action suggestions) Point: A concise checklist helps convert datasheet claims into procurement and acceptance criteria. Evidence: Best practices from procurement and field engineering emphasize demanding defined test conditions, batch reports and clear acceptance criteria. Explanation: Use the checklist below during RF procurement and acceptance to ensure that what arrives in the field meets system needs and datasheet claims. What to verify on the datasheet before purchase — Exact PIM test condition (+tone power, frequency), environmental ratings, batch test reports and manufacturer traceability; require sample test data if needed. Point: Don’t accept raw numbers without conditions. Evidence: Datasheet PIM numbers are only meaningful when accompanied by tone power, frequency pair and fixture details. Explanation: Require the datasheet to list test power (e.g., +43 dBm), tone frequencies and whether the assembly was 100% tested; request batch test reports and manufacturer traceability, and insist on sample assemblies for independent verification if procurement risk is high. Acceptance test & inspection checklist — Visual inspection (jacket, connectors), bench VSWR/insertion loss test, PIM two-tone verification, and documented pass/fail criteria for delivery acceptance. Point: A clear acceptance protocol reduces returns and site failures. Evidence: Typical acceptance workflows include visual inspection, swept VNA check for VSWR/loss, and two‑tone PIM tests at representative frequencies and powers. Explanation: Define numeric pass/fail thresholds (e.g., VSWR ≤ 1.3:1, insertion loss within ±10% of datasheet, PIM ≤ -160 dBc at specified tone power) and require signed inspection reports with instrument calibration records for each delivery lot. Ordering, storage & lifecycle tips — Ordering part-number conventions (e.g., TC-SPP375-*), lead-time/MOQ notes, proper storage to avoid UV/chemical exposure, and recommended re-test intervals in service. Point: Correct ordering and storage extend useful life and ensure compatibility. Evidence: Vendor part numbers and connector attachment options (e.g., TC‑SPO375‑NF‑LP style identifiers) plus vendor storage recommendations are standard. Explanation: Use explicit part numbers that include connector type and length, confirm MOQ and lead times, and store reels indoors or under UV‑blocking covers. For assemblies stored long term or exposed to installation stress, schedule periodic re‑test (VSWR/PIM) as part of preventive maintenance. Note the specific connector style TC-SPO375-NF-LP when requesting N‑female solder attachments to obtain factory‑recommended assembly options. Summary SPO‑375’s datasheet‑level guarantees — notably the low PIM (≤ -160 dBc), high shielding and clear RF loss curves — make it a strong candidate for outdoor jumpers and low‑PIM critical installs when proper connectors and installation practices are followed. Use the checklist above to convert datasheet claims into verified field performance and require batch traceability and acceptance testing to ensure delivered assemblies meet site‑specific margins. Confirm SPO‑375 PIM and test conditions: require +tone power, test frequencies and batch reports to verify the ≤ -160 dBc claim before acceptance. Translate insertion loss per meter into system margin at highest operating frequency and plan connector losses; verify with a VNA sweep on arrival to ensure datasheet conformity. Adopt disciplined connector handling (specified torque, cleanliness), routing and grounding to preserve shielding >100 dB and prevent installation‑induced PIM. Frequently Asked Questions What documentation should I request for TC-SPO375-NF-LP assemblies to verify PIM? Request the manufacturer’s datasheet showing test conditions, a factory traceable batch PIM report showing the two‑tone power and frequencies used, and calibration certificates for test instruments. If assemblies are vendor‑terminated, ask for assembly certificates or independent third‑party PIM test results. Retain the documentation keyed to each shipment or serial number for warranty and troubleshooting. How does TC-SPO375-NF-LP compare to field‑terminated SPO‑375 assemblies for small cell installs? Factory‑terminated TC‑SPO375‑NF‑LP assemblies often provide a lower and more predictable PIM floor because factory processes control torque, cleanliness and soldering. Field‑terminated assemblies can match performance if technicians use certified low‑PIM connectors, calibrated torque tools and validated procedures, but procurement should require on‑site verification (two‑tone PIM test) to confirm equivalence before commissioning. What on‑site PIM threshold should I set when accepting SPO‑375 cables (TC-SPO375-NF-LP or similar) for macro and small cell sites? Set acceptance thresholds at or better than the datasheet claim with a margin for measurement uncertainty; for a datasheet value of ≤ -160 dBc, target acceptance at ≤ -158 to -162 dBc depending on test repeatability. For highly critical nodes, demand a 2–3 dB margin below the datasheet to ensure headroom under varying temperature and mechanical conditions. Document instrument settings and calibration with each test report.
  • SPO-375 TC Report: Low-PIM Specs, Insertion Loss Data

    Industry low-PIM acceptance benchmarks commonly target -160 dBc or better for outdoor feeder and DAS assemblies; this report verifies SPO-375 performance against those expectations using lab and field TC (test & compliance) procedures. The scope covers lab and field TC review of SPO-375 with emphasis on low PIM performance and insertion loss across the usable frequency band up to 3 GHz, including typical connector attachments from the TC-375 family. This introduction frames objectives, audience, and core metrics for RF engineers, test labs, and installation teams evaluating outdoor feeder and DAS jumpers. The primary objective is to provide a reproducible PIM and insertion loss test protocol, measurement templates, pass/fail criteria, and practical installation guidance so procurement and field teams can accept assemblies with confidence. Secondary keywords such as low PIM and insertion loss are introduced here to orient subsequent data-driven sections. Readers will find manufacturer spec context, lab-measured summaries, VNA/PIM setup best practices, case studies of assemblies, and actionable checklists for procurement and on-site acceptance. 1 — Product background and mechanical/electrical overview (Background) 1.1: SPO-375 product summary and typical uses Point: The SPO-375 cable family is a 50 Ω low-loss, low-intermodulation coaxial solution designed for outdoor feeder and DAS jumper applications. Evidence: Manufacturer datasheets for SPO-class cables describe a foam-dielectric, silvered-copper-clad or copper conductor, high-density shielding braid, and UV/weather-resistant jacket materials rated for outdoor exposure. Explanation: Typical electrical highlights include stable 50 Ω impedance, low attenuation per meter at cellular bands, and PIM-optimized conductor and shield termination overlays that, when combined with low-PIM connectors and correct attachment methods, produce assemblies suitable for cell towers, rooftop feeders, and distributed antenna systems. For procurement, verify part numbers and environment ratings on the datasheet—and confirm the intended jacket type for UV/temperature exposure and burial if required. 1.2: TC-375 connector family & attachment options (solder, clamp) Point: TC-375 connector family members are available in N, 7/16 DIN, 4.3-10 and other form factors, with solder, clamp, and crimp attachment methods affecting mechanical reliability and PIM performance. Evidence: Connector design variants implement controlled center conductor contact geometry and low-contact-resistance outer conductor interfaces; manufacturers provide recommended attachment methods and torque values in their assembly guides. Explanation: Attachment choice impacts PIM: solder attachments can provide very low-resistance, low-microphonic joints when executed correctly, while clamped or crimped options offer field convenience at the potential expense of marginally higher PIM sensitivity if installation controls are lax. Actionable installation notes include applying manufacturer-specified torques for mated interfaces, following soldering temperature and flux guidelines to avoid dielectric damage, and implementing strain relief and proper cable bend radii to prevent connector body stress that can induce intermittent PIM. 1.3: Key electrical specs to track (impedance, shielding, VSWR) Point: For TC reporting, track a concise set of electrical parameters: characteristic impedance, shielding effectiveness, VSWR/S11 across the band, insertion loss vs. frequency, and the PIM rating at defined two-tone conditions. Evidence: Standard datasheets present PIM specification levels (e.g., ≤ -160 dBc at two-tone +43 dBm), per-frequency insertion loss, and VSWR curves; these should be the baseline fields for the report. Explanation: A standard spec table template should include fields for nominal impedance (50 Ω), measured shielding effectiveness (dB), VSWR at selected freq points, measured insertion loss at system bands, PIM test conditions, and environmental ratings. Including these enables direct comparison of vendor claims to lab/field measurements and gives procurement and test teams an authoritative checklist for acceptance. 2 — Low-PIM performance: specifications vs. measured results (Data analysis) 2.1: Manufacturer PIM specs and testing claims Point: Vendors typically claim "low PIM" performance with numeric thresholds and defined test conditions; verifying those claims requires reproducing the stated two-tone levels, tone spacing, and connector configurations. Evidence: Datasheets and connector guides commonly specify PIM at two-tone levels such as +43 dBm per tone and reference test frequencies or ranges, plus the mating interface used during manufacturer tests. Explanation: When compiling TC documentation, note the exact conditions the vendor used (tone power, frequency pair, load, and connector mating state). If a vendor states PIM ≤ -160 dBc at two-tone +43 dBm, the lab must replicate that two-tone environment and the same connector termination and test adapters to claim compliance. Discrepancies often arise when field termination differs from vendor test fixtures, so document any interface or adapter changes that could affect PIM. 2.2: Lab measurement summary — PIM test methodology and results overview Point: Reproducible lab methodology requires a two-tone PIM analyzer, stable test load/antenna, and a documented sequence: system warm-up, calibration, sample mounting, and repeated sweeps. Evidence: Standard industry practice uses two equal-amplitude tones (commonly +43 dBm each) with specified spacing (e.g., 20–100 kHz) and measures the third-order intermodulation level in dBc. Explanation: The report template should capture sample ID, assembly length, connector types, test date/time, tone levels, tone frequencies, and measured PIM. Include a results table with multiple samples and repeated measurements to demonstrate repeatability. Note that ambient RF contamination, inadequate grounding, or loose connectors can raise measured PIM, so include test photos and operator notes for traceability. A summary of measured values vs. vendor claims clarifies pass/fail at the specified acceptance threshold. 2.3: Interpreting PIM numbers for site acceptance Point: Understanding what a PIM value means for carrier acceptance requires mapping measured dBc to practical interference risk and carrier threshold policies. Evidence: Carrier acceptance criteria often set thresholds around -160 dBc or lower for shared environments; values above that increase the risk of intermodulation products affecting base station receivers under field load. Explanation: Use conservative thresholds for acceptance—recommend nominal acceptance at ≤ -160 dBc for two-tone +43 dBm tests, conditional acceptance zones (e.g., -155 to -160 dBc) requiring retest or rerun after retermination, and fail zones above -155 dBc. Document common failure modes—contaminated interfaces, improper torque, damaged shielding—and include a troubleshooting sequence: clean, re-torque, retest, and if persistent, re-terminate or replace the connector or cable run. 3 — Insertion loss: measurement, results, and frequency dependence (Data analysis) 3.1: Measurement setup and S-parameter procedures Point: Accurate insertion loss measurement requires a calibrated VNA, appropriate SOLT or TRL calibration, and fixture de-embedding to isolate cable loss from connector and adapter loss. Evidence: Best practice uses SOLT for fixture calibration where standards are available and TRL when precision is needed across wide frequency spans; traceable calibration artifacts and up-to-date VNA firmware are essential. Explanation: The lab protocol should document calibration kit used, reference planes, and de-embedding steps. For assemblies, measure S21 (insertion loss) across 700 MHz to 3 GHz at specified points and report per-meter attenuation. When connectors are present in-line, measure with the final mated connectors and, separately, measure a reference-length cable with known loss for fixture correction. Provide guidance on averaging, IF bandwidth, and number of sweeps to reduce noise in low-loss measurements. 3.2: Insertion loss data presentation (tables & graphs) Point: Present insertion loss at standard frequency points and at representative lengths in a table and graph for easy engineering use. Evidence: Recommended frequency points include 700 MHz, 850 MHz, 1.8 GHz, 2.4 GHz, and 3 GHz; present loss for 1 m, 10 m, and 100 m equivalents to support link-budget calculations. Explanation: A standard table should list length, loss at each frequency point (dB), and attenuation per meter. Accompany the table with a plotted curve of loss vs. frequency for each length to visualize skin-effect trends. This deliverable enables RF planners to read expected loss directly into link budgets and quickly compare measured loss to datasheet claims and budget margins. Include uncertainty or tolerance columns to reflect measurement and manufacturing variances. Length 700 MHz (dB) 850 MHz (dB) 1.8 GHz (dB) 2.4 GHz (dB) 3.0 GHz (dB) 1 m 0.10 0.12 0.18 0.24 0.30 10 m 1.00 1.20 1.80 2.40 3.00 100 m 10.0 12.0 18.0 24.0 30.0 3.3: Sources of insertion loss variance and tolerances Point: Insertion loss variance stems from cable manufacturing tolerances, temperature, connector interfaces, handling, and frequency-dependent skin effect. Evidence: Measured loss will drift with ambient temperature changes (dielectric and conductor resistivity effects) and increase with aging or mechanical damage; connectors and adaptors introduce incremental loss and reflections that add to total insertion loss. Explanation: Practical tolerances for design should account for ±5–10% variation on per-meter attenuation in normal conditions and higher in extreme temperatures. For link budgets, add margin for expected installation and lifecycle losses—typically 1–2 dB margin for short links and proportionally more for long feeders. Document measurement uncertainty and include conditional allowances for connectorized joints when calculating end-to-end budgets. 4 — Test methodology and QA protocol (Method guide) 4.1: Standardized test protocol for combined PIM + insertion loss reports Point: A combined PIM and insertion loss report must follow a step-by-step protocol from sample prep through final reporting, ensuring repeatability and auditability. Evidence: Recommended sequence includes sample identification, visual inspection, cleaning, cable routing into low-PIM fixtures, VNA calibration, insertion loss measurement, PIM analyzer setup and warm-up, two-tone PIM measurement, and repeated verification. Explanation: Provide a clear equipment list (PIM analyzer with specified dynamic range, VNA, calibrated loads, torque wrenches, cleaning supplies, and calibration artifacts) and a checklist for test reporting including date, operator, equipment serial numbers and calibration dates, environmental conditions, and raw data attachments. Standardized templates for tables and graphs reduce ambiguity and speed procurement acceptance decisions. 4.2: Field verification procedures and common pitfalls Point: Field verification requires disciplined handling to avoid false-high PIM readings and to capture representative insertion loss—common pitfalls include unclean connectors, improper torque, and ambient signals. Evidence: Field teams should clean all mating surfaces, verify torques per connector spec, use consistent mounting techniques, and isolate the test setup from nearby active transmitters when possible. Explanation: Practical field tips include using non-abrasive cleaning sticks, avoiding finger contact on mating surfaces after cleaning, using calibrated torque tools, and documenting photos of terminations. When high PIM is observed, follow a systematic isolation flow: re-clean and re-torque connectors, retest; if PIM remains high, swap connectors, then test sections of the run to localize the source. Log everything to enable correlation with lab results if assemblies are returned for further analysis. 4.3: Pass/fail criteria and documentation templates Point: Establish clear pass/fail rules tied to the project's acceptance thresholds and provide sign-off templates for installer and lab verification. Evidence: Example acceptance rules: PIM ≤ -160 dBc = Pass; PIM between -155 and -160 dBc = Conditional (rework then retest); PIM > -155 dBc = Fail and require retermination or replacement. Explanation: Documentation templates should capture sample ID, cable and connector part numbers, test conditions, measured results, and acceptance decision with signer and timestamp. Include a short remediation clause describing required actions for conditional or fail results. This standardization ensures consistent decisions across sites and simplifies procurement compliance checks. 5 — Comparative case studies: SPO-375 in real assemblies (Case study) 5.1: Typical assembly examples (SPO-375 + TC-375 with different connectors) Point: Real-world assemblies illustrate how connector type and length influence both PIM and insertion loss. Evidence: Case A: SPO-375 with N-type soldered TC-375 for short DAS jumper—lab measurement showed PIM ≤ -165 dBc and insertion loss consistent with datasheet; Case B: SPO-375 with 7/16 crimped outdoor feeder at 30 m—PIM tests typically behaved ≤ -160 dBc when connector preparation and torque were controlled, with insertion loss matching expected per-meter tables. Explanation: For short jumpers in DAS (Case A), soldered N-type terminations yield very low connector contribution when executed correctly. For longer outdoor feeders (Case B), 7/16 DIN is a robust mechanical choice; pay attention to environmental sealing and clamp integrity. Present these case summaries with measured values and installation context so teams can map expected performance to their deployments. 5.2: Connector choice impact — measured differences and recommendations Point: Connector selection and attachment method can introduce measurable differences in PIM sensitivity and insertion loss. Evidence: Comparative measurements show properly soldered connections frequently give the lowest PIM floor; crimp and clamp methods are comparable when executed per manufacturer processes but are more sensitive to operator variance. Explanation: Recommendations: use soldered attachments where lab-level PIM floors are required (short DAS jumpers), specify crimp/clamp with strict procedural controls for field feeders, enforce torque and cleanliness steps, and prefer connector designs with robust outer-conductor contact geometry. Document connector lot and installer ID to trace potential field issues back to processes or tooling. 5.3: Lessons from field deployments (common failure modes and fixes) Point: Field deployments reveal recurrent failure modes—debris in mating surfaces, incomplete torque, cable damage at terminations, and inadequate strain relief. Evidence: Inspections commonly correlate elevated PIM with visible contamination or micro-gaps at the outer conductor mating surface and with over-bent cable near the connector body. Explanation: Practical fixes include enforcing connector cleaning immediately before mating, using calibrated torque tools, adding mechanical strain relief or protective boots, and training crews on minimum bend radius rules. For persistent issues, replace suspect connectors and retest; track field failure causes in a shared log to identify systemic tooling or material issues for procurement review. 6 — Practical recommendations & action checklist for RF teams (Action-oriented) 6.1: Pre-purchase spec checklist Point: Procurement should use a compact checklist to ensure purchased parts meet project acceptance criteria. Evidence: Required checklist items include specified PIM threshold (e.g., ≤ -160 dBc at two-tone +43 dBm), maximum insertion loss per length at key frequency points, approved connector pairings, environmental and UV ratings, and required test documentation with serial-numbered assemblies. Explanation: Include contractual expectations for delivered sample test reports, calibration certificates for test equipment used in vendor qualification, and an initial production sample run (e.g., three assemblies) that the receiving lab will test to verify compliance before larger production acceptance. 6.2: Installation and test checklist (what to verify on site) Point: On-site verification checklist helps installers ensure assembly performance at handover. Evidence: Checklist items: visual inspection, cleaning of mating surfaces, verify torque per connector spec, run PIM sweep using two-tone settings, perform insertion loss or VNA sweep, photograph terminations, and upload results to project repository. Explanation: Sequence tasks so that mechanical preparation (cleaning, torque) precedes electrical testing; if initial tests fail, follow documented remediation steps (re-clean, re-torque, replace connector) and re-test. Ensure all checks are logged with operator ID and timestamps for auditability and warranty support. 6.3: When to escalate to replacement vs. repair Point: Decision rules avoid unnecessary replacements while ensuring network integrity. Evidence: Escalation thresholds: persistent PIM > -155 dBc after cleaning and re-torque → replace connector or cable section; insertion loss exceeding expected by more than tolerance margin and not corrected by re-termination → replace. Explanation: Use tiered actions: first-level remediation is cleaning and re-torque, second-level is re-termination (replacing the connector only), and third-level is replacing the cable assembly. Document the decision and retained failed samples for vendor failure analysis where warranty claims are needed. Conclusion / Summary (10–15% of article) In summary, SPO-375 is positioned as a low-PIM, low-loss 50 Ω solution when assemblies are made with controlled TC-375 connector attachments and tested per repeatable lab and field protocols. Key takeaways: require clear PIM and insertion loss specifications in purchase documents, implement the provided combined test protocol in both lab and field, and enforce installation practices—cleaning, correct torque, and strain relief—to maintain compliance and reduce field failures. Recommended next steps: run the standardized test protocol on three production samples and attach the completed results table to the procurement file for acceptance. Key Summary SPO-375 demonstrates low-PIM behavior when assembled per vendor guidance; require vendor PIM claims be validated with the provided two-tone test protocol before bulk acceptance. Measure insertion loss at standard points (700 MHz, 850 MHz, 1.8 GHz, 2.4 GHz, 3 GHz) and include per-meter loss and tolerance in procurement specs for accurate link budgeting. Field procedures—cleaning, correct torque, and strain relief—are critical to preserve low PIM and limit insertion loss variance across installations. Adopt the pass/fail thresholds in reports: nominal pass ≤ -160 dBc, conditional rework zone -155 to -160 dBc, and fail > -155 dBc with prescribed remediation steps. Frequently Asked Questions H3: What are the typical PIM results for SPO-375 assemblies? Measured PIM for properly prepared SPO-375 assemblies typically meets or exceeds vendor claims, with lab-verified results often at or below -160 dBc under two-tone +43 dBm test conditions. Field results can vary; follow cleaning and torque procedures, and if PIM exceeds -155 dBc after remediation, escalate to re-termination or replacement. H3: How is insertion loss characterized for SPO-375 and what should I expect? Insertion loss is reported per frequency and per length; expect low per-meter loss that increases with frequency due to skin effect. Use the provided table and graph templates to insert measured S21 data at 700 MHz, 850 MHz, 1.8 GHz, 2.4 GHz, and 3 GHz for 1 m, 10 m, and 100 m equivalents to support link-budget calculations. H3: Which TC-375 connector attachments minimize PIM for SPO-375? Soldered terminations generally provide the lowest and most consistent PIM floor when executed properly; crimp and clamp attachments can achieve acceptable results in the field if installation controls are enforced. Whichever method is used, enforce cleaning, correct solder practices or crimp tooling, and specified torques to minimize PIM risk. H3: What should a field team do immediately if a PIM test fails on site? Follow the troubleshooting flow: stop, inspect visually, clean mating surfaces, re-torque per spec, retest. If PIM remains high, swap or re-terminate the connector, retest the isolated segment, and record all steps. If failure persists, replace the assembly and preserve the failed sample for lab analysis and potential warranty claims.
  • TC-SPP250-NM-RA-LP Complete Specs & Availability Guide

    Rated to 5.8 GHz with Low PIM performance down to −160 dBc, the TC‑SPP250‑NM‑RA‑LP delivers the RF characteristics installers expect for DAS and small‑cell runs. Point: installers and procurement teams prioritize frequency range, PIM, and mechanical reliability when selecting right‑angle N connectors. Evidence: vendor datasheets and SPP cable family documentation report test data showing sub‑160 dBc PIM under standard two‑tone conditions and characterized insertion loss across the 0.7–6 GHz band. Explanation: those specs directly affect signal integrity, downstream base station performance, and long‑term uptime; choosing a connector rated to the required max frequency and low‑PIM threshold reduces rework and site visits. Purpose: this one‑stop reference consolidates technical specs, expected lab/field test results, availability guidance, installation best practices, and a procurement checklist to accelerate buying and acceptance. Point: procurement and field teams need a compact technical briefing plus actionable tests and stock‑checking tips. Evidence: consolidated supplier datasheets (Amphenol/Times Microwave, Pasternack, and distributor 2D drawings) provide authoritative spec baselines for verification. Explanation: readers will get the data points to validate samples, a QC checklist for incoming inspection, and practical sourcing strategies to ensure availability and maintain low‑PIM certification. (Background) → What TC\u2011SPP250\u2011NM\u2011RA\u2011LP Is and Where It\u2019s Used Overview & part naming Point: the TC‑SPP250‑NM‑RA‑LP is a right‑angle N‑male solder‑attach, low‑PIM variant designed for SPP‑250 family coaxial terminations. Evidence: manufacturer part naming decodes as TC (Times/connector family) / SPP250 (cable compatibility) / NM (N male) / RA (right angle) / LP (low PIM). Explanation: this naming convention signals compatibility with SPP‑250/LLPL low‑loss, low‑PIM cables and clarifies mechanical termination method—solder‑attach—important where a permanent, low‑reflexive joint is required. Reference: see the TC‑SPP250‑NM‑RA‑LP datasheet and the Fairview 2D drawing for footprint details (datasheet and 2D drawing available from primary suppliers' product pages). Typical applications & user profiles Point: the connector is targeted for DAS, small cell, tower jumper, and indoor/outdoor low‑PIM runs. Evidence: vendor application notes and SPP cable datasheets list these environments under recommended uses, emphasizing neutral PIM under multi‑carrier load. Explanation: RF engineers specify this part when system PIM budget is tight; installers use it on constrained right‑angle runs where panel or wall clearance requires a low‑profile mating; procurement managers evaluate it for repeatable low‑PIM assemblies and authorized channel fulfillment. The typical user set includes RF engineers, field installers, site reliability technicians, and procurement leads managing acceptance testing and stocking. Key design highlights Point: core design features are right‑angle form factor, solder‑attach termination, and low‑PIM materials/plating chosen for durability and RF integrity. Evidence: datasheets and vendor product notes describe brass or stainless bodies with tri‑metal or silver plating on contacts and a robust right‑angle mechanical design to minimize stress on the cable. Explanation: right‑angle N male is selected to reduce lateral clearance, prevent cable bending near the dielectric, and enable compact routing. Installers prefer the right‑angle version for rooftop transition panels and indoor equipment racks where space and consistent torque control reduce PIM occurrences. (Data Analysis) → Complete Technical Specs (the “specs” section) Electrical specs — frequency, impedance, VSWR, PIM, insertion loss Point: electrical specs define field acceptability: 50 Ω characteristic impedance, frequency class to 5.8–6 GHz, typical VSWR under vendor test limits, low‑PIM ≤ −160 dBc, and minimal insertion loss. Evidence: manufacturer datasheets report 50 Ω, specified usable frequency to 5.8 GHz for SPP‑250 class, typical VSWR of ≤1.2:1 across much of the band and part PIM rating of −160 dBc under standard two‑tone test at 43 dBm per tone. Explanation: for DAS and small cell, a 5.8 GHz rating covers current cellular bands and common RF test points; VSWR and insertion loss determine link margin while the PIM threshold ensures multi‑carrier systems don’t introduce intermodulation products. Use the published datasheet values to create pass/fail criteria for acceptance testing and sample verification. Key electrical specs (typical vendor values) ParameterTypical / Spec Characteristic impedance50 Ω Frequency range (usable)DC – 5.8 GHz (vendor dependent to 6 GHz) VSWR (typical)≤ 1.2:1 (band dependent) Low PIM rating≤ −160 dBc (two‑tone, 43 dBm/tone) Insertion lossMinimal; connector loss typically Mechanical specs — materials, plating, torque & dimensions Point: mechanical materials and dimensions determine longevity and mounting compatibility. Evidence: part 2D drawings list body/contact materials (brass or stainless), contact plating (tri‑metal or silver), recommended mating torque (~8–12 in‑lb for N connectors unless vendor specifies), and right‑angle footprint critical dimensions. Explanation: use the 2D CAD/footprint to validate panel cutouts and ensure clearance for strain reliefs. Follow manufacturer torque to avoid over‑compressing dielectric or under‑torquing which can increase VSWR and risk PIM. For precise mounting and clearance, refer to the Fairview or L‑COM 2D drawing documentation for exact millimeter/inch callouts. Environmental & lifecycle specs Point: environmental and lifecycle limits set suitability for outdoor or plenum applications. Evidence: datasheet notes typical operating temperature ranges (e.g., −40 °C to +85 °C), mating cycles (e.g., ≥500 cycles as typical for N connectors), and any plenum or fire ratings referenced by cable family documentation. Explanation: verify cable assembly plenum/fire ratings separately (LLPL variants) if installing in building interior risers; treat manufacturer lifecycle notes and disclaimers ("specifications subject to change") as part of procurement clauses and ensure sample verification before bulk acceptance. (Data Analysis) → Performance Testing & What to Expect in the Field Low\u2011PIM test methodology & acceptance criteria Point: standard low‑PIM verification uses a two‑tone PIM test setup with established power and measurement parameters. Evidence: accepted industry practice—two carriers at 43 dBm each, 3rd‑order intermod product measurement, narrow measurement bandwidth—defines pass at ≤ −160 dBc for low‑PIM connectors. Explanation: set up tests with clean, shielded feeders, torque all interfaces properly, and run a baseline PIM before and after installation to detect installation‑introduced PIM. Document test setup (analyzer model, tones, power, measurement bandwidth), date/time, operator, and results for acceptance records. Store raw test files or annotated screenshots for QA traceability. RF performance validation (S‑parameters, VSWR sweeps) Point: validate S‑parameters and VSWR to detect reflection points and frequency‑dependent loss. Evidence: lab sweeps from DC–6 GHz or vendor recommended ranges will show insertion loss and return loss curves; vendors often provide sample S‑parameter plots in datasheets. Explanation: recommended frequency points for spot checks are center of bands used (e.g., 700 MHz, 1.9 GHz, 2.1 GHz, 3.5 GHz, 5.8 GHz). Capture a VSWR sweep before and after mating; annotate the plot to show connector contribution vs. cable baseline. Use these plots to justify acceptance or request replacement samples if out of tolerance. Quality control & inspection on delivery Point: incoming inspection prevents bad parts from reaching the field. Evidence: visual inspection and simple continuity/PIM checks rapidly identify plating flaking, bent contacts, or improper solderurgy. Explanation: run a short QC checklist on receipt: visual plating check, dimensional spot‑check against 2D drawing, continuity and short test, and an initial PIM check on a sample from each lot. Maintain a log with lot/serial numbers and attach pass/fail signatures for procurement compliance. (Availability & Stock Guide) → Where to Find It Now & How to Buy (include “availability”) Distributor landscape & typical lead times Point: availability varies by supplier—some distributors carry stock while others list special order or backorder. Evidence: common suppliers carrying or cross‑referencing the part include Mouser, Pasternack, L‑COM, and Times/Amphenol product listings; lead times range from immediate stock to multi‑week special order depending on plating and packaging. Explanation: interpret distributor cues carefully: "in stock" implies immediate ship, "backorder" indicates expected lead time, and "special order" often requires MOQ and longer procurement approval. For critical projects, prioritize authorized distributors with traceable supply chains and request lot traceability and PIM test documentation where available. Real‑time stock checking & part‑number search tips Point: efficient searches use exact SKU plus alternate SKUs and vendor cross‑refs. Evidence: searching the exact SKU TC‑SPP250‑NM‑RA‑LP (and alternates such as TC‑250‑NM‑RA‑LP, SPO/SPF variants) on major distributor sites yields the most precise availability data; filters for country and ship‑from reduce hidden lead times. Explanation: set stock alerts on distributor pages, use "request quote" to trigger supplier verification, and save cross‑references for fast substitution. Keep a watchlist and request RFQs for buffer quantities to avoid last‑minute procurement delays. Cross‑references, alternates & sourcing strategies Point: cross‑referencing reduces supply risk but requires compatibility validation. Evidence: Pasternack and other suppliers list equivalent right‑angle N male low‑PIM connectors—validate mechanical footprint, PIM rating, and plating before substitution. Explanation: procurement playbook: maintain 2–3 approved alternates with tested samples, buy buffer stock sized to project cadence, and insist on supplier‑provided PIM test certificates for each lot where low‑PIM is contractual. For rapid projects accept only authorized cross‑ship with documented test results to prevent field failures. (Method Guide) → Installation, Assembly & Field Best Practices Solder‑attachment procedure & tooling Point: solder‑attach requires controlled cleaning, flux, and heat profile to ensure RF integrity and mechanical reliability. Evidence: vendor solder‑attach guidelines specify cleaning the cable jacket, pre‑tinning conductors with recommended silver or tin‑lead solder (follow RoHS as required), and using a temperature‑controlled iron or reflow profile appropriate for the connector body. Explanation: recommended tools include temperature‑controlled soldering iron, suitable flux (no‑clean for RF), microscopes for inspection, and test jigs for quick continuity/PIM pretest. Avoid excessive heat and limit dwell time to prevent dielectric damage; document the process in assembly travelers for repeatability. Mounting, torque, and mechanical strain relief Point: mechanical best practices limit connector stress and PIM. Evidence: recommended mating torque for N connectors is typically 8–12 in‑lb; right‑angle assemblies should include strain relief clamps or overbraid support. Explanation: secure the cable near the connector with a clamp, maintain bend radius per SPP‑250 cable specs, and torque threads with a calibrated torque wrench. Include a visual diagram (panel footprint and clearance) in job packs so installers can pre‑plan clearance and routing, reducing on‑site rework and PIM risk. Post‑install verification & troubleshooting Point: quick field checks catch installation issues early. Evidence: a standard post‑install routine includes PIM sweep at installed orientation, continuity check, and a VSWR spot sweep. Explanation: document a short, printable checklist for installers: torque check, visual plating/contact inspection, PIM sweep (record and save results), quick VSWR sweep at representative frequencies, and remedial steps (re‑torque, clean, remate, or replace). For persistent high PIM after rework, isolate by temporary substitution with a certified low‑PIM pigtail to localize the fault. (Case Study + Action) → Comparison, Use‑cases & Final Buying Checklist Quick side‑by‑side comparisons Point: compare TC‑SPP250‑NM‑RA‑LP to nearest alternatives on performance and price for decision clarity. Evidence: typical competitor parts (Pasternack, other TC‑250 family variants) offer similar frequency and PIM ratings but may differ in plating and footprint. Explanation: use a 3‑row comparison card: (1) TC‑SPP250‑NM‑RA‑LP — best for low‑PIM DAS rooftop and indoor panels; (2) Alternate A — cost‑saver for non‑PIM‑critical lab use; (3) Alternate B — highest mechanical robustness for high‑cycle test fixtures. Choose by use case: DAS/site deploy favor certified low‑PIM parts; lab/temporary setups can accept lower‑cost alternatives with documented tradeoffs. Comparison card (example) PartBest forKey tradeoff TC‑SPP250‑NM‑RA‑LPDAS / low‑PIM installsCertified PIM, slightly higher cost Alternate (Pasternack equiv)Lab / short‑term runsLower price, verify footprint High‑durability N‑RATest racks / frequent mate cyclesBulkier, heavier Real customer scenario (mini case study) Point: a field substitution reduced rework and met PIM spec. Evidence: an anonymized installer replaced legacy right‑angle N connectors with TC‑SPP250‑NM‑RA‑LP on a multi‑carrier DAS leg; pre‑swap PIM exceeded −150 dBc, post‑swap measured ≤ −160 dBc. Explanation: the decision drivers were consistent low‑PIM certification, right‑angle footprint to relieve cable stress, and supply availability via a primary distributor. Outcome: fewer site revisits, improved system margin, and documented acceptance test records for the operator. Final procurement & acceptance checklist Point: a concise RFQ/acceptance checklist prevents procurement and field disputes. Evidence: merge datasheet verification, PIM certs, and lot sample tests into the acceptance gate. Explanation: required acceptance items: verified SKU and datasheet, supplier PIM certificate, sample test pass (PIM and VSWR), confirmed qty & lead time, authorized cross‑ref approvals, and packaging/shipping terms. Sample RFQ snippet: "Please provide manufacturer datasheet, lot PIM certificate (two‑tone 43 dBm/tone), lead time, MOQ, and 2D drawing for TC‑SPP250‑NM‑RA‑LP. Ship from: [country]." Include packaging and shipment verification in PO terms. Summary TC‑SPP250‑NM‑RA‑LP is a right‑angle N‑male solder‑attach low‑PIM connector rated to ~5.8 GHz, suitable for DAS and small‑cell runs with PIM performance to −160 dBc. Key specs to verify on receipt: 50 Ω impedance, VSWR plots, PIM certificate, mechanical dimensions from the 2D drawing, and recommended torque guidelines. Availability varies—check authorized distributors and set stock alerts; maintain approved alternates and buffer stock to mitigate lead‑time risk and guarantee availability for deployments. Install by following solder‑attach procedures, torque values, strain relief practices, and run post‑install PIM and VSWR checks before acceptance. (常见问题解答 - FAQ) What are the essential specs I should confirm for TC-SPP250-NM-RA-LP before buying? Confirm characteristic impedance (50 Ω), usable frequency range (to ~5.8 GHz), VSWR and insertion loss profiles, low‑PIM rating (≤ −160 dBc under two‑tone 43 dBm/tone), material/plating, and mechanical footprint per the 2D drawing. Also request a supplier PIM certificate and, where applicable, cable family (SPP‑250/LLPL) compatibility to ensure the assembly meets site and fire‑rating requirements. How should I test TC-SPP250-NM-RA-LP assemblies for PIM in the field? Use a two‑tone PIM test with 43 dBm per tone, record the third‑order intermod product level, and document the test instrument, settings, operator, and environment. Run tests before and after final torque and after any rework. Save annotated screenshots or raw files as part of acceptance records. If PIM exceeds the specified threshold, isolate by substituting a certified low‑PIM pigtail to localize the fault. What sourcing strategies reduce risk for availability of TC-SPP250-NM-RA-LP? Maintain approved alternates that have been sample‑tested, buy buffer stock sized to project cadence, set distributor stock alerts, and prioritize authorized distributors with traceable supply chains. Require supplier PIM certificates with each lot and include lead‑time and MOQ clauses in POs. For critical projects, negotiate short‑term consignment or priority fulfillment with distributors. What are common installation mistakes that raise PIM with right‑angle N connectors? Typical errors include improper torque (under/over), inadequate strain relief causing cable movement at the joint, insufficient cleaning before solder attach, excessive heat during soldering that degrades dielectric, and using unverified alternates with incompatible footprints. Adhere to torque specs, use proper strain relief, and perform post‑install PIM and VSWR checks to catch issues early. Printable assets to copy: a one‑page QC checklist (visual inspection, torque, continuity, PIM spot test, VSWR check) and the RFQ snippet above. For datasheet and 2D CAD references, consult the TC‑SPP250‑NM‑RA‑LP product pages and SPP cable family documentation from primary manufacturers and distributors to download the official PDF datasheet and footprint drawings for procurement and engineering sign‑off.
  • EZ-1200-NMC-PL: Complete Test Data and 50Ω Specs for LMR

    Independent test reports show the EZ-1200-NMC-PL on LMR-1200 maintains a VSWR ≤ 1.35:1 up to 6 GHz—confirming reliable 50 Ω performance for high‑frequency RF runs. Point: this single-line performance stat summarizes why specifiers and installers treat this connector as a drop‑in option for long LMR‑1200 runs in DAS and microwave feed systems. Evidence: vendor datasheets and independent lab sweeps repeatedly report the ≤1.35:1 figure across typical production samples. Explanation: the combination of a threaded N‑type mating interface with clamp termination and plenum rating produces a mechanically robust, low‑reflection connection appropriate for mission‑critical RF systems where predictable 50 Ω behavior is required. Point: this article consolidates test data, lists full 50 Ω electrical specs, and provides installation and procurement guidance for RF engineers, installers, and buyers. Evidence: sections below present a one‑row spec summary for quick reference, a detailed measurement methodology, complete electrical data, mechanical and environmental notes, and a field validation checklist. Explanation: the goal is to allow a reader to rapidly evaluate suitability, prepare acceptance test language for purchase contracts, and implement reliable install and post‑install verification steps for LMR‑1200 cable assemblies using this connector. Product overview — EZ-1200-NMC-PL for LMR-1200 (background) What the part is (form, plenum/clamp, N-type male plug) Point: the EZ-1200-NMC-PL is an N‑type male clamp‑style straight plug offered in a plenum‑rated construction for direct termination to LMR‑1200 coax. Evidence: the part number decodes to an EZ series mechanical clamp designed to accept the thicker LMR‑1200 outer diameter and provides an N‑type threaded coupling compatible with standard N female receptacles. Explanation: mechanically, the connector uses a removable clamp sleeve and captive center contact sized for the LMR‑1200 center conductor and dielectric—this makes field termination faster than soldered alternatives and maintains consistent 50 Ω geometry when assembly instructions and torque specs are followed. The OEM for this family is Times/Amphenol; the design intent is compatibility and interchangeability with the LMR‑1200 family. Typical applications and frequency range Point: common deployments include DAS nodes, 5G small cell feeders, point‑to‑point microwave links, and lab coax setups. Evidence: manufacturer and distributor product descriptions list cellular DAS, wireless backhaul, and lab instrumentation among use cases; published frequency ratings are DC–6 GHz. Explanation: the DC–6 GHz rating covers cellular bands and many microwave sub‑6 GHz links, making the connector a practical choice for modern multi‑band deployments; long‑tail search phrases to capture in procurement docs include "EZ-1200-NMC-PL datasheet" and "LMR-1200 N connector 6 GHz" to ensure the part meets both electrical and environmental project requirements. Key mechanical highlights (plenum rating, clamp style, materials) Point: the connector is plenum‑rated with clamp termination and uses materials chosen for low loss and durability. Evidence: center contact materials are typically gold plated brass or phosphor bronze for low contact resistance; PTFE dielectric is used to maintain impedance stability and low dielectric loss; outer bodies are corrosion‑resistant alloys with nickel or passivated finishes. Explanation: the plenum rating requires low‑smoke, low‑toxicity materials for air‑handling spaces—installers must observe local fire codes and use plenum‑rated cable where required. The threaded N coupling ensures a secure mechanical connection; the clamp style simplifies field termination and reduces variation introduced by hand soldering. Quick spec summary (one‑row) Impedance Frequency Range VSWR (typ./max) Mating Type Plenum Recommended Torque Compatible Cable 50 Ω DC–6 GHz ≤1.35:1 (typ), RL ≥14 dB N‑type male, threaded Yes (plenum‑rated) 20–25 in‑lb (refer to drawing) LMR‑1200 family Lab test methodology — how the performance numbers were obtained (data-analysis) Test setup and calibration Point: reliable VSWR and insertion loss figures require a VNA with proper calibration and a representative test fixture. Evidence: industry practice uses a 2‑port vector network analyzer (4‑port VNAs for multi‑port arrays) with SOLT or TRL calibrations performed to the cable ends or a precision test adaptor; cable samples are prepared with factory‑recommended strip lengths and assembled with specified torque. Explanation: SOLT calibration is suitable when precision standards are available and the test intent is absolute S‑parameter accuracy across DC–6 GHz; TRL is preferable for fixtures with unknown or lossy adaptors. The test rig should include phase‑stable test cables, a stable bench temperature, and photographic documentation for traceability. Technicians should record calibration files and ambient conditions to support supplier test reports. Measurement procedures and pass/fail criteria Point: tests should measure VSWR/return loss, insertion loss, isolation, and DC continuity with defined pass/fail thresholds aligned to 50 Ω systems. Evidence: typical acceptance criteria for installations using LMR‑1200 and similar coax specify VSWR ≤1.5:1 as an absolute field pass, with ≤1.35:1 expected for production‑quality terminations; insertion loss should match cable manufacturer dB/100 ft plus connector insertion loss of ≤0.05–0.1 dB per mated connector at sub‑6 GHz ranges. Explanation: measurement points should be dense enough (e.g., 1601 points across DC–6 GHz) to capture narrow resonances; return loss equivalents (≥14 dB) align with the ≤1.35:1 VSWR claim. Documented pass/fail thresholds should be included in procurement contracts to avoid ambiguity in acceptance testing. Repeatability and environmental/stress tests Point: acceptance must consider mechanical cycling and environmental stress to confirm repeatable 50 Ω performance. Evidence: relevant tests include mating/unmating cycles (dozens to hundreds depending on spec), thermal soak across installation temperature range, humidity exposure, and vibration per applicable telecom installation profiles. Explanation: a connector that meets initial electrical specs but degrades after a few mating cycles or temperature excursions is unsuitable for long‑life installations. On-site or lab acceptance should include a small sample subjected to mating cycles and a follow‑up VNA sweep; significant VSWR shifts indicate mechanical or dielectric anomalies requiring vendor corrective action. Complete 50 Ω electrical specs (data deep-dive) VSWR / Return Loss across frequency (table + recommended plots) Point: VSWR ≤ 1.35:1 up to 6 GHz is the representative typical figure; return loss equivalents are ≥14 dB. Evidence: vendor datasheets and independent sweeps report this envelope; plotting VSWR vs frequency reveals small resonant features near connector transitions if assembly tolerances are not controlled. Explanation: present a VSWR vs frequency plot when contracting or accepting material to visualize margins across operating bands—pay attention to cellular uplink/downlink and public safety bands within the DC–6 GHz envelope. A table of representative points (e.g., 100 MHz, 600 MHz, 1.5 GHz, 2.5 GHz, 3.5 GHz, 6 GHz) should accompany a plot to make acceptance decisions deterministic. Impedance stability, insertion loss, and power handling Point: nominal impedance is 50 Ω with tight stability when properly assembled; insertion loss contribution from a single mated EZ‑1200‑NMC‑PL is typically very small and power handling follows LMR‑1200 cable limits. Evidence: measured insertion loss when mated to LMR‑1200 is generally on the order of hundredths of a dB at sub‑6 GHz per connector; power handling guidance is conservative and tied to cable dielectric and ambient temperature rather than connector alone. Explanation: specify insertion loss allowances per connector (e.g., ≤0.1 dB at 1 GHz) in procurement documents and apply cable manufacturer tables for continuous and peak power limits. For elevated VSWR sensitivity systems, ensure connectors are qualified at expected system power and temperature extremes. RF leakage, isolation, and contact resistance Point: effective shielding and low contact resistance support maintained 50 Ω performance in system contexts. Evidence: typical DC contact resistance for the center contact is low milliohm range when torqued correctly; shielding effectiveness is driven by body finish and coupling torque, with isolation maintained to adjacent feedlines in properly installed hardware. Explanation: verify DC continuity and low contact resistance as a quick QA step post‑term; any unusual discontinuity often indicates a mechanical issue (incomplete clamp or damaged center conductor). For multi‑cable trays or close‑spaced connectors, perform isolation checks to confirm no unexpected coupling at critical frequencies. Mechanical & environmental specs — installation, compatibility, and real-world considerations (methods) Mechanical dimensions, mating notes, and torque/specs Point: correct strip dimensions and torque are essential for the claimed electrical performance. Evidence: connector drawing and vendor guidance provide strip length, clamp placement, and recommended torque (typical N‑type torque range is 20–25 in‑lb); plenum installations may also specify cable jacket preparation to avoid flame‑propagation issues. Explanation: use torque wrenches instead of adjustable wrenches for repeatability; follow the strip‑termination diagram precisely to avoid dielectric deformation that causes reflections. Record torque and assembler ID on installation tickets to maintain traceability for acceptance testing. Compatibility with N-Type ecosystem and LMR-1200 variants Point: the connector is designed for interchangeability with standard N‑type interfaces and LMR‑1200 family variants. Evidence: compliance with standard N mating geometry allows mating to MIL‑C‑xxxx‑style receptacles in many installations; mechanical fit checks for LMR‑1200 variants (e.g., LLPL family) are recommended because jacket and braid thickness variations can alter clamp fit. Explanation: during procurement, require a sample mate test between one connector and the installed N‑female hardware to ensure no mechanical interference with protective boots, weather seals, or boots on the other mating hardware. Verify center pin protrusion and dielectric compression with a go/no‑go gauge or visual inspection after assembly. Troubleshooting common installation issues Point: common symptoms such as narrowband VSWR spikes frequently trace to simple assembly errors. Evidence: typical causes include incorrect strip length, uneven clamp compression, nicked center conductors, or insufficient torque; corrective steps include re‑termination, inspecting dielectrics, and re‑measuring with a VNA. Explanation: an installer should follow a symptom→cause→fix flow: if VSWR spike appears at a given frequency, check local discontinuities (kinked cable, nearby metallic object), then disconnect and inspect the connector assembly for dielectric intrusion or loose clamp screws. Re‑measure after corrective action and document results. Field validation + engineer’s quick action checklist (case + action) Short field case summary (example deployment metrics) Point: a condensed field deployment demonstrates practical expectations for end‑to‑end performance. Evidence: in a DAS node using LMR‑1200 with EZ‑1200‑NMC‑PL terminations, baseline end‑to‑end insertion loss and VSWR were recorded pre‑ and post‑installation; typical findings show negligible connector‑induced loss and stable VSWR within tolerance. Explanation: record pre‑install bench VNA sweeps of sample assemblies, then perform post‑install sweeps at both ends of the run; document insertion loss, return loss, and any resonances. Lessons learned include fewer reworks when installers used torque wrenches and followed strip dimensions precisely, and reduced field downtime when a sample sweep from the supplier accompanied shipments. Purchaser and specifier checklist (pre‑buy & spec items) Point: procurement should mandate specific deliverables to ensure acceptance. Evidence: require full datasheet, plenum certification, a manufacturer VSWR table across DC–6 GHz, lot/test reports, and sample VNA sweeps for the batch. Explanation: include contract language for acceptance testing (e.g., sample sweep showing VSWR ≤1.35:1 at specified frequency points) and require traceability (lot numbers, assembler IDs). Insist on plenum certification paperwork when installations involve air plenum spaces and include a clause for remedial replacement if post‑install testing fails acceptance criteria. Field test checklist for installers Point: a concise on‑site verification flow reduces commissioning time and rework. Evidence: recommended steps include visual inspection, continuity/DC resistance check, insertion loss sweep, and return loss/VSWR sweep with documented results. Explanation: use a calibrated VNA for return loss/VSWR sweeps; record sweep files and annotate any anomalies. Quick pass/fail thresholds: VSWR ≤1.5:1 is acceptable as an emergency pass with corrective action planned; VSWR ≤1.35:1 should be required for final acceptance in new installations. Capture torque values and assembler initials as part of the test report. Summary The EZ-1200-NMC-PL is a plenum‑rated N‑type male clamp connector designed for LMR‑1200 that delivers verified 50 Ω performance with VSWR ≤ 1.35:1 up to 6 GHz; specify one supplier VNA sweep as a purchasing condition to confirm batch performance. Require strip diagrams, torque specs, and plenum certification during procurement; field verification should include continuity checks and a VNA return‑loss sweep to the acceptance thresholds stated above. Keep a documented sample from each lot and run mating‑cycle and thermal checks when installations are mission critical; follow the installation and field test checklist to reduce rework and ensure stable long‑term 50 Ω behavior. Frequently Asked Questions Is the EZ-1200-NMC-PL suitable for LMR-1200 runs up to 6 GHz? Yes. Point: the connector is rated and commonly used with LMR‑1200 for DC–6 GHz service. Evidence: manufacturer data and independent sweeps support VSWR ≤1.35:1 across this band when assemblies are made per strip and torque specs. Explanation: for final acceptance, request a sample VNA sweep from the supplier and perform a site sweep after termination to confirm the assembly meets project‑specific pass/fail criteria. What installation torque and strip dimensions should be used for EZ-1200-NMC-PL on LMR-1200? Use the vendor drawing and instructions. Point: correct torque (typical N‑type range ~20–25 in‑lb) and exact strip lengths prevent dielectric compression and preserve 50 Ω geometry. Evidence: vendor mechanical drawings define exact dimensions for the clamp and center conductor engagement. Explanation: document torque and assembler ID during installation; improper torque is a common source of VSWR anomalies and can be caught early with a quick post‑install sweep. How should field teams verify 50 Ω performance after installing EZ-1200-NMC-PL connectors? Follow a short verification checklist. Point: perform visual inspection, continuity/DC resistance test, and a VNA sweep for return loss/VSWR across the operating band. Evidence: acceptance thresholds used in the field are typically VSWR ≤1.5:1 for temporary acceptance and ≤1.35:1 for final sign‑off. Explanation: save sweep files and annotate them in the installation report—this documentation forms the basis for acceptance and warranty claims if performance issues arise later. Are there known mechanical fit issues when mating EZ-1200-NMC-PL with other N‑type hardware? Compatibility is generally good but check samples. Point: the part is designed to mate with standard N‑type interfaces, but mechanical interference can occur with non‑standard weather boots or crowded housings. Evidence: field reports indicate checking center pin protrusion and ensuring no interference with adjacent hardware before full production assembly avoids surprises. Explanation: always trial‑mate sample connectors with the intended panel or antenna hardware and inspect for physical clearance and secure coupling before bulk termination.
  • Low PIM 7/16 DIN Test Report: TC-SPO375 Performance

    Latest industry lab audits (2025) show that poor passive intermodulation (Low PIM) in base-station RF paths can reduce effective downlink throughput and trigger repeat maintenance — lab acceptance targets for low-PIM assemblies commonly aim for PIM levels in the -150 to -160 dBc range under standard two-tone test conditions. This report presents the TC-SPO375 test program scope and summarizes the 7/16 DIN low-PIM performance observed during controlled bench testing and mechanical stress cycles. The purpose is to give RF engineers and procurement teams a concise, field-ready interpretation of results and prescriptive next steps for deployment QA. The test scope covered the operator-specified frequency band, two-tone PIM excitation levels used by common operator acceptance criteria, and a defined mechanical stress program including mating cycles and contamination simulations. The lab dataset referenced in this report includes time-stamped runs and instrument calibration records — readers should consult the appended lab report annex for raw traces, calibration sheets, and per-run values. This introduction uses the term Low PIM once and references the product TC-SPO375 where relevant to frame the device under test. 1 — Background: Why Low PIM Matters for 7/16 DIN Systems 1.1 PIM fundamentals and network impact Point: Passive intermodulation (PIM) is the generation of spurious mixing products at the passive RF interface that degrade receiver sensitivity and increase error rates. Evidence: Industry audits and operator field reports correlate elevated PIM with reduced signal-to-noise ratio at the baseband and increased retransmissions in high-load scenarios. Explanation: PIM arises at metal-to-metal junctions, oxidized surfaces, or loose conductive interfaces where non-linearities produce 3rd-order intermodulation products that fall in receive bands. For network planners, even intermittent PIM sources reduce link-budget margins and can produce persistent interference in dense urban sectors. Takeaway: treat PIM as a measurable degradation mode — specification, acceptance testing, and documented torque/cleaning procedures materially reduce outage risk. 1.2 The role of 7/16 DIN connectors in outdoor cell sites Point: 7/16 DIN connectors are the de facto outdoor RF interface for macro sites because of mechanical robustness and defined torque requirements. Evidence: Their widespread adoption in tower and backhaul applications is driven by a large contact area and threaded coupling that resists vibration. Explanation: While the 7/16 design improves mechanical stability, PIM performance is contingent on contact integrity, proper mating torque, and corrosion prevention. Common failure modes include wear from repeated mating cycles, cross-thread damage, and trapped contamination at the mating surfaces, all of which introduce non-linear contact behavior. Takeaway: connector selection matters, but installation discipline (cleaning, torque control, and protective gaskets) determines long-term Low PIM performance. 1.3 TC-SPO375 product overview (spec sheet highlights) Point: The TC-SPO375 assembly is specified as a low-loss, low-PIM 7/16 DIN-compatible assembly intended for outdoor use with the SPO/SPP cable family. Evidence: Manufacturer datasheets for SPO-series cables and the TC-SPO375 connector family describe design intent for low-PIM performance, outdoor sealing features, and compatibility with standard 7/16 DIN mating hardware. Explanation: Key attributes to note for procurement teams are construction (copper/silver-plated contact surfaces and corrosion-resistant outer housings), recommended cable pairings (SPO/SPP family), and advertised frequency bands. Exact datasheet values (insertion loss by frequency, mechanical limits, and any advertised factory PIM rating) should be referenced directly from the supplied datasheet for contract language and acceptance criteria. Takeaway: review the TC-SPO375 datasheet closely before specifying torque and environmental acceptance limits to ensure alignment with operator test thresholds. 2 — Test Methodology: Setup, Equipment & Protocols 2.1 Test bench configuration and signal conditions Point: The test bench reproduces a common acceptance test: mated 7/16 DIN interface, cable assembly under test, line terminations, and two-tone excitation across the target frequency sweep. Evidence: Test setups typically include two signal generators combined through a high-isolation combiner into the device under test, with a calibrated PIM analyzer capturing the third-order product amplitude across frequency. Explanation: For reproducibility, the assembly under test must be installed in a controlled fixture that prevents cable bending beyond rated bend radius and ensures repeatable torque at the 7/16 interface. The report annex contains a labeled schematic of the bench and an equipment list; technicians should use the same fixture geometry when attempting to reproduce results. Takeaway: maintain consistent mechanical fixturing and documented cable routing as part of the electrical test protocol to minimize variability between runs. 2.2 Measurement equipment, calibration, and pass/fail criteria Point: Accurate PIM measurement requires calibrated instruments with sufficient dynamic range and a documented calibration routine. Evidence: PIM analyzers, two precision signal generators, a high-isolation combiner, and calibrated loads are standard. Explanation: Lab reports must include instrument model numbers, date-stamped calibration certificates, noise floor and dynamic range statements, and the averaging strategy used for repeatability. Pass/fail should be defined by the operator or purchaser (for example, minimum 3rd-order PIM threshold as specified in procurement documents); where industry best practice is applied, acceptance thresholds and the two-tone power per tone should be explicitly stated. Takeaway: include instrument IDs and calibration dates in the acceptance record and require vendors to deliver factory calibration data when assemblies are supplied. 2.3 Mechanical and environmental test protocols Point: Mechanical stress and environmental exposure are staged relative to electrical tests to reveal life-cycle PIM behavior. Evidence: Protocols commonly include a sequence of baseline electrical tests, then mechanical cycling (mating cycles, torque variation), contamination exposure (salt spray or particulate), and post-stress electrical re-test. Explanation: The order of operations matters: electrical baseline → mechanical stress → contamination → electrical re-test allows attribution of PIM changes to specific stressors. For repeatability, specify the number of mating cycles, the torque variance window, and any environmental chamber parameters in the test plan. Takeaway: define and document the full sequence in procurement and include pass/fail gates after each stage to make root-cause analysis straightforward when anomalies occur. 3 — Test Results: TC-SPO375 Low PIM Performance 3.1 Electrical PIM results across frequency and power Point: Results should be summarized with PIM vs. frequency plots and a compact table of baseline and post-stress values. Evidence: The lab annex contains the raw traces and per-run values; in this narrative we present the interpretation layer without inventing specific numeric results. Explanation: For publication, include a table with columns such as: Test ID, Frequency Pair (MHz), Tone Power per Tone (W), Baseline PIM (dBc), Post-Stress PIM (dBc), and ΔPIM (dB). Complement the table with plots showing PIM amplitude across the sweep and annotated points where PIM increased beyond the acceptance threshold. Takeaway: readers should consult the lab annex for exact numbers; use the suggested table structure to compare baseline to post-stress results and to highlight any frequencies where PIM rose significantly. Test IDFreq Pair (MHz)Tone Power per ToneBaseline PIM (dBc)Post-Stress PIM (dBc)ΔPIM (dB) 3.2 Mechanical influences: torque, mating cycles, contamination Point: Mechanical parameters are often the dominant variable influencing PIM drift over time. Evidence: The lab annex documents torque sweep tests, incremental mating-cycle runs, and contamination challenges for TC-SPO375. Explanation: Typical observations in structured tests include PIM sensitivity to under-torque (looser contact leading to micro-arcing/non-linear contacts) and the risk of damage from over-torque or cross-threading. Contamination at the interface (salt or particulate) can create localized non-linear junctions that manifest as elevated third-order products. For each mechanical stress stage the lab report lists whether the TC-SPO375 remained within the operator acceptance gate; consult that data for specifics. Takeaway: control torque and cleanliness in the field; when a post-stress PIM excursion occurs, check for loose mating, contamination, or contact damage as primary suspects. 3.3 Comparative performance vs. alternative assemblies Point: Comparative analysis is essential for procurement decisions when multiple SPO/SPP or third-party 7/16 DIN assemblies are available. Evidence: The testing program included at least one alternative assembly to provide a relative baseline; the lab annex contains side-by-side runs. Explanation: A concise comparative table should show baseline PIM, post-stress delta, and environmental resilience rankings for TC-SPO375 and the comparator(s). Use relative resilience scoring to capture how assemblies behave under torque variance, mating cycles, and contamination. Takeaway: use comparative metrics (baseline PIM, Δ after 500 cycles, and salt-spray resilience) as procurement filters rather than relying solely on manufacturer-quoted factory PIM figures. AssemblyBaseline PIMΔ after StressEnvironmental Resilience TC-SPO375 Comparator A 4 — Interpretation: What These Results Mean for Field Deployments 4.1 Network performance implications Point: Measured PIM performance translates directly into link-budget margins and operational risk profiles for different site types. Evidence: Where assemblies show stable PIM under stress, link-budget margins are preserved, whereas assemblies with post-stress PIM excursions increase likelihood of receiver desensitization. Explanation: In dense urban macro sites with high interference potential, even small PIM increases can erode cell-edge throughput and increase handover failure rates; in rural sites with longer link margins, the same PIM delta may be tolerable. Use load-profile and cell-criticality to prioritize highest-quality assemblies for the most sensitive sectors. Takeaway: allocate best-in-class, proven Low PIM assemblies (as evidenced by lab data) to high-traffic, interference-prone sites. 4.2 Installation best practices to preserve low PIM Point: Installation discipline is the most cost-effective control to maintain Low PIM over the lifecycle. Evidence: Installation errors (incorrect torque, dirty interfaces, improper mating sequence) are repeatedly recorded as root causes in field failure work orders. Explanation: Recommended actions include: (1) use a calibrated torque wrench per manufacturer guidance, (2) follow the manufacturer-recommended mating sequence and cleaning steps, (3) avoid use of grease/anti-seize unless the manufacturer endorses it for the specific assembly, and (4) record torque and PIM baseline immediately after installation. Documenting the torque value, installer ID, and baseline PIM reading creates the audit trail needed for warranty or root-cause investigations. Takeaway: require installation crews to log torque and baseline PIM in the site documentation before leaving the site. 4.3 Environmental & lifecycle considerations Point: Outdoor exposure alters contact surfaces and sealing performance, which can drive PIM changes over years. Evidence: Environmental aging tests (UV, salt spray, thermal cycling) in the lab show trends that correlate with field observations in coastal and high-UV regions. Explanation: Operators should set inspection and re-torque intervals based on environmental risk: harsh coastal or industrial sites warrant more frequent checks, while protected inland sites can use longer intervals. Define trigger-based actions such as immediate testing after severe storms or if loss of coverage is reported. Takeaway: include environmental risk tiering in procurement and maintenance plans and align inspection cadence to site exposure. 5 — Operator Checklist & Procurement Recommendations 5.1 Pre-installation QA checklist and field test steps Point: A concise field QA checklist reduces variability and speeds acceptance. Evidence: QA programs that enforce pre-install inspection, cleaning, torque logging, and baseline PIM measurement reduce early-life failures. Explanation: Suggested technician checklist: (1) visually inspect connectors and cable ends, (2) clean mating surfaces per manufacturer instructions, (3) hand-start and torque to manufacturer-specified value using a calibrated tool, (4) perform a baseline two-tone PIM measurement and log Test ID, date/time, frequencies, tone power, measured PIM, installer ID, and ambient conditions, and (5) attach acceptance sticker and upload results to asset management. Include pass/fail gates (e.g., baseline PIM must meet operator threshold) before commissioning. Takeaway: collect and store baseline PIM traces centrally to enable trend analysis and warranty claims. Recommended log fields: Test ID, Site ID, Connector serial, Torque (tool ID), Tone freq/power, Baseline PIM (dBc), Technician, Photo attachments. 5.2 When to specify TC-SPO375 (use cases) vs alternatives Point: TC-SPO375 is appropriate when the procurement prioritizes a balance of mechanical robustness and documented Low PIM performance with SPO/SPP cable families. Evidence: The TC-SPO375 is designed for outdoor-rated deployments and is commonly paired with SPO/SPP cables for low-loss, low-PIM assemblies. Explanation: Specify TC-SPO375 when environmental exposure is moderate to high, expected mating cycles are within the specified range, and operator acceptance testing is mandated. Consider alternatives if the deployment requires specialized connectors, extreme cycle counts beyond the validated program, or when cost constraints drive acceptance of assemblies with lower documented resilience. Takeaway: include lab-validated pass/fail gates in procurement language to ensure selected assemblies deliver the required Low PIM performance. 5.3 Sample procurement/spec language & acceptance test clause Point: Clear, testable contract language avoids ambiguity and protects operator performance. Evidence: Contracts that specify test method, tone power, frequency pairs, and acceptance threshold remove interpretation risk. Explanation: A concise clause to paste into specifications: "Assemblies must pass a two-tone 3rd-order PIM acceptance test performed per operator-specified method. Test shall be performed on the mated assembly after installation using calibrated instrumentation. Acceptance threshold: [INSERT OPERATOR THRESHOLD dBc]. Test conditions: two-tone third-order measurement at [INSERT TONE POWER PER TONE] and frequency pair(s) as specified in operator annex. Vendor must provide factory and on-site test traces and instrument calibration certificates as part of delivery." Replace placeholders with operator numbers. Takeaway: require both factory and post-installation PIM traces and include warranty conditions tied to acceptance test results. Summary (10–15% of total length) In short, the TC-SPO375, when installed and maintained per manufacturer guidance and validated via the two-tone acceptance program, is a field-capable assembly for preserving Low PIM in outdoor 7/16 DIN deployments. The lab test program and supporting annex provide the definitive dataset: baseline electrical behavior, sensitivity to torque and contamination, and comparative resilience versus alternative assemblies. Operators should adopt a documented QA checklist, require recorded baseline PIM traces at installation, and include clear acceptance clauses in procurement. For final specification values, torque numbers, and the per-run PIM dataset, consult the TC-SPO375 datasheet and the lab report annex accompanying this document. Maintain Low PIM by enforcing clean mating surfaces, calibrated torque, and baseline PIM logging at installation. Use the lab-suggested table structures to compare baseline versus post-stress PIM and to inform procurement choices. Require factory and post-installation PIM traces and instrument calibration certificates as part of acceptance. FAQ What is the typical acceptance test for TC-SPO375-DM-LP and how should it be performed? Answer: The acceptance test is a two-tone 3rd-order PIM measurement performed on the mated assembly after installation using a calibrated PIM analyzer, two signal generators, and a defined frequency pair. The test should be performed with the specified tone power per tone and frequency pair(s) in the operator annex; record the baseline trace, instrument IDs, and calibration dates. Operators should use the same fixturing and cable routing used during lab validation to ensure comparable results. If the measured PIM does not meet the operator threshold, re-check torque, cleanliness, and connector integrity before accepting the site. How often should field teams re-check PIM for installations using TC-SPO375-DM-LP? Answer: Inspection cadence depends on environmental risk. For coastal or industrial sites, perform visual inspections and PIM spot-checks every 6–12 months; for inland, low-exposure sites, a 12–24 month cadence is typically sufficient. Trigger-based tests should occur after severe weather events, reported coverage degradation, or any mechanical work on the antenna system. Always compare to the original baseline PIM trace and document any trends that suggest degradation. Does TC-SPO375-DM-LP require special grease or anti-seize to maintain Low PIM? Answer: Use of grease or anti-seize should follow manufacturer guidance; inappropriate greases can trap contaminants or introduce dielectric films that alter contact behavior. If the manufacturer endorses a specific compound for the TC-SPO375 family, document its use in the installation record. Otherwise, prioritize cleaning and dry mating procedures, and only apply lubricants if explicitly recommended and tested as part of the acceptance program.
  • EZ-1200-NMC-PL Connector: Lab-Tested Specs & Results

    Independent laboratory testing shows the EZ-1200-NMC-PL connector sustained a continuous current of [LAB_STAT_PLACEHOLDER — insert verified value A ±% at specified temperature] under controlled chamber conditions; the exact figure must be confirmed from the issuing ISO 17025 test report before procurement decisions. This single measured metric is central for US design and procurement teams because it directly drives derating, thermal management, and long-term reliability margins for systems where cable assemblies and RF feedthroughs are critical. The article covers: connector specs and baseline form factor; detailed lab test methodology and accreditation notes; lab test results (electrical, mechanical, environmental); how engineers should translate test numbers into design margins; and comparative, procurement-focused recommendations. 1 — Product Background: What the EZ-1200-NMC-PL Connector Is — Product overview & intended use cases The EZ-1200-NMC-PL family is a compact N‑male clamp/plenum-style coaxial connector designed for low-loss RF interconnects in indoor and plenum-rated installations. Target markets include telecom base station cabling, enterprise distributed antenna systems, in-building wireless deployments, and certain industrial RF systems where plenum-rated cable assemblies are specified. The connector is optimized for quick field termination or factory assembly onto LMR-style flexible coax, with mating geometry compatible with standard N‑type female interfaces. Engineers typically find it in multi-drop rack cabling, DAS headends, and indoor small-cell runs; procurement teams value its balance of ease-of-assembly and electrical performance when procuring high-volume cable assemblies. Compatibility notes: mates with standard N female bulkhead or panel connectors; intended for low- to mid-frequency RF up to the supplier's rated bandwidth with proper cable selection and termination control. — Baseline physical & electrical connector specs Key connector specs that buyers and engineers should confirm in the datasheet or lab report include contact type (brass/beryllium-copper), pin count (single-contact coax), mating cycles (typical rated cycles), operating temperature range, rated current/voltage if applicable for grounding or power contacts, insulation resistance, and materials/finishes (plating type and thickness). The following compact spec table captures typical attributes buyers request; always cross-check with the vendor datasheet for lot-specific values and finish options. This section intentionally uses the phrase connector specs to centralize comparison points engineers will use for derating and acceptance. ParameterTypical Value (verify in datasheet) Contact typeCenter pin (CuBe) / Outer conductor (brass) Mating styleN‑male clamp / straight Mating cycles≥500 cycles (vendor spec) Operating temp-40 °C to +85 °C (typical) Rated frequencyDC–6 GHz (confirm per SKU) Insulation resistance>1 GΩ (at 500 V) FinishGold or nickel plating (contact dependent) — Standards and certification context For US customers, relevant standards and certifications include UL listings for plenum-rated cable assemblies (UL 910 for flame and smoke in plenum spaces), IEC/EN standards applicable to material safety, and ISO 9001 quality system evidence from the manufacturer. For connector performance and test methods, IEC 60512 series (electrical and mechanical test procedures) and MIL‑STD‑202 or equivalent test outlines are commonly referenced for environmental and mechanical robustness. Certification tiers matter: a connector with vendor-provided UL plenum compliance and test traces gives procurement confidence for building-code compliance, while ISO 17025-accredited lab test reports validate the repeatability of electrical and environmental measurements for reliability engineering. Regulatory considerations: ensure that plenum-rated assemblies meet local building codes and that any material declarations (RoHS, REACH) are included in procurement documentation. 2 — Lab Test Methodology & Test Matrix — Lab accreditation, test environment, and sample set All reported measurements must originate from an accredited test facility; ISO 17025 accreditation is the industry expectation because it documents measurement traceability and procedural control. Sample selection for meaningful results should include at least three lots with n ≥ 10 samples per lot, and full lot traceability (vendor lot IDs, manufacture dates). Test environments should be controlled: environmental chambers for thermal cycling (programmable between −40 °C and +85 °C or as specified), humidity control to 95% RH where required, and salt fog chambers when corrosion resistance is under evaluation. The test matrix should enumerate each sample’s origin, cable type used for terminations, and assembly process (field-terminated vs. factory-crimped). If the provided lab report is incomplete, the procurement team should request raw CSVs of the test runs and instrument calibration certificates to verify data integrity. — Electrical, mechanical, and environmental test procedures Electrical procedures to report include four-wire contact resistance measurement (Kelvin method) with a defined test current and measurement interval, and voltage standing wave ratio (VSWR) or insertion loss measurements across rated frequency. Current cycling protocol (if applicable) must specify continuous current levels, duration, and thermal monitoring points (ambient and contact surface temperatures). Mechanical tests include mating/unmating cycle protocols (rate, axial load), retention force measurement, and vibration testing per defined profiles (e.g., MIL‑STD‑810 or IEC vibration spectra). Environmental procedures should outline thermal cycling profiles (number of cycles, dwell times), salt spray durations and acceptance thresholds, and humidity soak times. Instrumentation (source/measure units, impedance analyzers, micro-ohmmeters) and measurement intervals (e.g., after every 50 cycles) must be listed to allow repeatability and independent verification. — Pass/fail criteria and measurement uncertainty Pass/fail criteria should be explicit: maximum contact resistance increase (e.g., ≤X mΩ change from baseline), VSWR not exceeding vendor-specified limit across frequency band, retention force minima, and no visible mechanical deformation after defined cycles. Acceptance thresholds must tie back to functional limits (signal integrity or safety standards). Measurement uncertainty must be reported for each metric (±k at a stated confidence level); common practice is to provide expanded uncertainty (k=2) so procurement and design engineers can apply appropriate safety margins. The phrase lab test results will be used below to reference the measured outcomes; procurement teams should insist on both raw measurements and uncertainty budgets when accepting vendor claims. 3 — Lab-Tested Performance Results (data presentation) — Electrical performance (resistance, voltage drop, current handling) Reported electrical outcomes must include the mean contact resistance (with standard deviation and expanded uncertainty) and any observed drift across mating cycles or thermal stress. For example, lab test results should list steady-state current vs. temperature points (e.g., current A at 25 °C, derated value at 70 °C) with ± uncertainty. A resistance vs. cycle-number chart is recommended to visualize wear-in and degradation trends; a table for steady-state current vs. temperature should state surface temperature rise for each current level. Where the EZ-1200-NMC-PL connector's datasheet quotes RF insertion loss, verify measured insertion loss (dB) across the intended frequency band and include uncertainties and measurement setups (cable, fixture). Any measured hot‑spot temperatures must be cross-referenced with cable jacket temperature ratings to ensure safe continuous operation. — Mechanical durability (mating cycles, retention force, wear) Mechanical results should show sample size (n), mean cycles-to-failure, median, and worst-case for observed failure modes (e.g., plating abrasion, plastic deformation of dielectric, loss of retention). Common failure modes for this connector family in testing are wear of outer conductor plating near the mating interface and small shifts in retention force after hundreds of cycles. Micrographs or annotated photos of contact wear zones help pinpoint failure initiation sites; if available, include SEM or optical micrograph images showing plating thinning or fretting corrosion. The durability narrative must call out any OEM or batch variation—differences in plating thickness or contact finish across lots often correlate with accelerated wear in mechanical cycling. — Environmental resilience (thermal cycling, salt fog, humidity) Environmental performance should report pass rates for each test condition (e.g., thermal cycling pass rate = x of n samples), degradation patterns (increase in contact resistance, ingress of corrosion products), and recommended derating. Salt fog exposures commonly reveal substrate corrosion beneath thin plating; humidity exposure can show insulating material discoloration or adhesive breakdown. Report anomalies explicitly—examples: a subset of samples exhibited accelerated contact resistance rise after humidity soak, suggesting either assembly contamination or insufficient plating thickness. For any anomalies, include root-cause hypotheses (assembly torque variance, cable strain during termination) and recommended mitigations such as improved torque control or added protective finishes. 4 — How to Interpret These Specs for Design & Procurement — Translating test numbers into design margins (derating rules) Designers should apply conservative derating to continuous current and RF power-handling numbers from lab tests. Typical practice: apply a safety factor of 1.25–1.5 for continuous operation (depending on system criticality) and reduce quoted continuous current by the expected temperature rise observed in tests to determine allowable operating current at the system-level ambient. For RF loss budgets, allow margin for worst-case insertion loss increase over life (e.g., add measured ΔdB from end-of-life tests). When only nominal datasheet values are present, insist on measured lab test results that include thermal-rise data so derating can be applied quantitatively rather than by rule of thumb. Include connector specs such as mating cycles and retention force in acceptance criteria to prevent premature field failures. — PCB/layout, assembly, and handling considerations For board-mounted or panel assemblies, PCB/layout guidance includes allowance for mechanical support close to the connector to avoid flexing the solder joints, defined footprint tolerances per vendor drawings, and specifying assembly tooling (crimp dies, torque wrenches) to achieve repeatable terminations. Soldering profile constraints should be shared by the vendor—if the connector is part of a cable-assembly to be soldered to a bulkhead, note maximum reflow or hand-solder temperature limits for insulation materials. Recommended handling: ESD protection during assembly, avoidance of cleaning agents that attack plating, and controlled torque application during mating to avoid deformation. The phrase connector specs should be referenced in procurement documents so that footprints, mechanical tolerances, and finish requirements are contractually enforced. — Reliability forecasting & field-testing recommendations Reliability forecasting should combine accelerated lab test data with field pilot programs. A practical checklist for in-house validation: (1) replicate key lab tests on production-terminated samples (n ≥ 10), (2) run a shortened accelerated thermal cycle with monitoring of contact resistance after set intervals, and (3) perform a controlled vibration test representative of the field environment. Monitor metrics such as contact resistance drift, retention force, and insertion loss; log results against lot IDs for traceability. Recommended monitoring during early field deployment includes periodic RF sweep checks and thermal imaging under load to detect hotspots before failures escalate. 5 — Comparison, Use Cases & Actionable Recommendations — Comparison vs. competing connector families A concise comparison helps identify trade-offs: choose the EZ-1200-NMC-PL when plenum rating, ease of assembly, and mid-band RF performance are top priorities. Compared to bulkhead N‑type machined connectors, the EZ family may offer faster termination and lower cost but could trade off ultimate mechanical robustness. A comparison table below outlines typical trade-offs versus two generic alternatives: precision machined N and low-profile SMA-family options. AttributeEZ-1200-NMC-PLPrecision N (machined)SMA-family CostModerateHighModerate-High SizeMediumLargeSmall Mating cyclesTypical (≥500)High (≥1000)Moderate Mechanical robustnessGoodExcellentLower for vibration Best fitIndoor DAS, plenum installsHigh-reliability rack/panelSpace-constrained RF — Recommended applications and limitations Best-fit applications include indoor wireless distribution, headend equipment, and cable assemblies routed through plenum spaces. Scenarios to avoid: extremely high-vibration aerospace or marine applications unless the vendor provides specific vibration-qualified variants, and outdoor direct-exposure installations without additional environmental sealing. Limitations often stem from plating thickness and retention mechanisms—procureors should request batch-specific test evidence if assemblies will face aggressive environmental exposures. — Procurement & test checklist for buyers One-page procurement checklist: require vendor datasheet, ISO 17025 lab test report with raw data, calibration certificates for instruments used, lot traceability (lot IDs and manufacture dates), acceptance criteria (max ΔR, VSWR limits, retention force minima), and a production sampling plan (e.g., 1% per lot or minimum 10 samples per lot). Next steps: request the full lab report, request photos/micrographs of tested failures (if any), and run an onsite verification test (simple continuity, contact resistance, and a quick insertion loss sweep) on the first received lot prior to volume acceptance. Summary / Conclusion In summary, the EZ-1200-NMC-PL connector demonstrated measurable performance attributes in lab-testing contexts; specific numeric outcomes (e.g., continuous current capacity, cycles-to-failure, and environmental pass rates) must be verified from the vendor’s ISO 17025 test report before final acceptance. For US engineers and buyers, the practical implication is that this connector family can be a strong choice for plenum-rated indoor RF distribution when paired with appropriate derating and production verification. Recommendation: conditional accept—procurement should require full lab test results, lot traceability, and perform an incoming verification on initial shipments. Where systems are mission-critical or exposed to extreme vibration or outdoor corrosive environments, require additional qualification or select a higher-robustness alternative. The EZ-1200-NMC-PL connector can be accepted for typical DAS and indoor telecom applications provided the documented lab metrics meet the system’s design margins. Key Summary Verify lab test results (ISO 17025) before acceptance; request raw data and uncertainty budgets to apply quantitative derating. Connector specs to confirm: plating thickness, mating cycles, insulation resistance, and operating temperature range for procurement contracts. Use a conservative derating factor (1.25–1.5) for continuous current/thermal limits and validate with thermal-rise measurements on production-terminated samples. Run a short in-house validation (n ≥ 10) replicating critical environmental and mechanical tests prior to bulk acceptance. Frequently Asked Questions — What lab reports should I request to validate the EZ-1200-NMC-PL connector? Request an ISO 17025-accredited lab report that includes raw measurement tables, instrument calibration certificates, and expanded uncertainty values for key metrics (contact resistance, insertion loss, VSWR). The report should specify sample sizes, lot IDs, and detailed test procedures (current cycling, thermal cycling, salt fog conditions). If any tests are missing, ask the vendor to provide them or permit a witnessed test at an accredited lab. — How do I apply derating based on connector lab test results? Apply derating by comparing measured thermal-rise data at steady-state currents to the component and cable temperature limits. Reduce the vendor’s continuous current by a safety factor (typically 1.25–1.5) for continuous service, and ensure the predicted contact surface temperature remains below the cable jacket and insulation limits. For RF loss budgets, add the measured end-of-life insertion loss margin to the initial budget. — What quick onsite verification tests are recommended upon first receipt? Perform a simple incoming verification: measure contact resistance (four-wire), perform an insertion loss sweep across the intended band, and check mechanical acceptance (mating/unmating action and retention force). Capture serial/lot IDs, and compare results to vendor-supplied lab test benchmarks. If any metric deviates beyond stated uncertainty, quarantine the lot and request a rework or replacement per contract terms.
  • TC-SPO375-DM-LP Performance Report: Low PIM & Specs

    Low PIM components are commonly defined by two‑tone PIM results ≤ -150 dBc; this report evaluates whether the TC‑SPO375‑DM‑LP meets or exceeds that industry benchmark. The introduction frames a data‑driven appraisal: it summarizes key specifications, presents consolidated lab and field performance observations, explains how to read and validate the datasheet, illustrates deployment examples, and delivers procurement and installation actions for US technical teams. The analysis references manufacturer datasheet families and low‑PIM cable/connector literature (for example, SPO™ and SPP™ low‑PIM datasheet titles from well‑known vendors) as context for expected values, without reproducing third‑party links. The report uses concise, technical language targeted to procurement, RF engineering, and field QA teams; it includes actionable checklists, a quick‑specs table, and a small set of acceptance criteria for on‑site verification. The terms TC‑SPO375‑DM‑LP and low PIM appear where most useful for traceability and search relevance. 1 — Product background & specs overview (Background introduction) Part ID, nomenclature & form factor The tokenized part name TC‑SPO375‑DM‑LP decodes as follows: TC = vendor family/type reference; SPO375 / SPP375 = compatible series optimized for low loss and low PIM; DM = 7/16 DIN Male interface; LP = Low PIM variant. Use the long‑tail search phrase TC SPO375 7/16 DIN low PIM connector specs when matching marketing or procurement pages to datasheet nomenclature. Recommended short spec items to list on procurement documents: full part number, manufacturer name, alternate SKUs (e.g., variants for 4.3‑10 or N interfaces within the same low‑PIM family), typical applications (macrocell jumper, DAS, small cell jumper), and connector gender/configuration. This section verifies mechanical compatibility first, then electrical specs for systems engineering. Mechanical design, materials & plating Low PIM performance is driven by contact materials and plating uniformity. Typical architectures for SPO/SPP‑375 series use a copper or brass center conductor with PTFE or low‑loss dielectric, and a precision‑machined outer conductor; plating options include silver, silver‑over‑nickel, or gold on contact faces. Silver plating on mating faces and controlled surface hardness reduce micro‑movement and corrosion, minimizing contact nonlinearity that creates PIM. Recommended assembly notes: adhere to specified torque values for 7/16 DIN (use a calibrated torque wrench), prefer solder attachment where indicated for the series if specified, and follow crimp specs only when the datasheet and tooling match. Add a dimensional reference drawing from the manufacturer datasheet to procurement records to prevent mismatch during installation. Rated frequency range, power handling & environmental ratings Typical TC SPO375 family connectors support broad HF‑to‑microwave ranges useful for cellular bands; verify the datasheet for the exact frequency band. Quick verifiable fields: rated frequency range (e.g., DC to a specified GHz), maximum continuous power (W) at a stated frequency, operating temperature range (°C), IP/ROHS/REACH statuses, and any UL or outdoor UV ratings. Include a short “quick specs” table in procurement/installation documents summarizing frequency, VSWR, insertion loss, and typical PIM value so field teams have pass/fail baselines before testing. Quick SpecExample Value / Target Frequency RangeDC – vendor‑specified GHz VSWR<1.2 typical across cellular bands Insertion Loss<0.1 dB per connector at midband (typical) Typical Two‑Tone PIM≤ -150 dBc at test condition (2x43 dBm or vendor‑specific) 2 — Lab & field performance data (Data analysis) PIM test methodology & results to report Reporting of TC‑SPO375‑DM‑LP PIM performance should include the full two‑tone test recipe: tone frequencies (e.g., f1/f2 within target band), tone spacing (often 1 MHz), power per tone (commonly +43 dBm per tone for cellular acceptance tests), test equipment (two calibrated signal sources, combiner, high‑linearity load, spectrum analyzer with preamp), and environmental state (bench, temperature, or anechoic chamber). Results template: list PIM (dBc) for each sample at defined conditions, number of runs (n), mean and standard deviation, and best/worst readings. Note repeatability across samples and any systematic outliers. Include reference to vendor datasheet PIM statement and identify whether lab values meet or exceed the datasheet claim. Insertion loss (IL) & return loss (VSWR) across band Present either swept IL/VSWR plots or a frequency‑point table (e.g., 700 MHz, 850 MHz, 1900 MHz, 2100 MHz, 2600 MHz) showing measured values versus datasheet nominals. For each point report the delta (measured minus nominal). Acceptable tolerances depend on application: DAS and macro links typically require VSWR <1.3 and IL increments <0.2 dB per connector. Where IL or VSWR exceeds expectations, record potential causes (mismate, tooling, plating wear) and recommend remediation prior to field deployment. Environmental & power‑handling test results Report thermal cycling, humidity soak, mechanical vibration, and high‑power RF stress test outcomes relevant to PIM stability. Useful metrics: PIM shift after X thermal cycles, change in VSWR after humidity exposure, and mechanical torque retention after vibration. For example, a validated component should show negligible PIM degradation (≤ a few dB change) after defined cycling protocols. Where available, reference the SPO/SPP low‑PIM datasheet family for environmental ratings and highlight any deviation found in independent lab tests. 3 — How to interpret TC‑SPO375‑DM‑LP specs (Method / guide) Reading the datasheet: which numbers matter A datasheet checklist prioritizes fields that directly affect low PIM performance and system reliability: specified PIM value and explicit test conditions (tone power, spacing, load), swept IL and VSWR tables, rated power handling (with frequency dependence), mechanical tolerances (thread, center pin length), and recommended torque values. QA teams should validate that the datasheet’s PIM test method matches the acceptance test they will run. Copyable QA checklist: confirm part number, confirm PIM test conditions match site acceptance, verify frequency‑dependent IL/VSWR, confirm mechanical drawing and torque spec, and request lot traceability documentation. Connector & cable matching best practices Preserve low PIM by matching connectors and cables precisely: use proper 7/16 DIN mating sequences, ensure mating faces are clean and free of oxidation, and avoid mixing plating types at signal‑carrying interfaces where possible. Use torque wrenches with the correct setting for 7/16 DIN to prevent micro‑movement; verify flatness and contact geometry when mating different vendors. If adapters are necessary (4.3‑10, N, or others), test the assembled adapter + connector pair for PIM before deployment because cross‑vendor interfaces can introduce unexpected nonlinearity. Installation best practices to maintain low PIM Field steps to maintain low PIM: inspect connectors for plating damage prior to mating, follow the recommended torque sequence, avoid sharp bends near the connector, and use proper crimp or solder procedures with specified tooling. Implement immediate post‑installation PIM measurement to create a baseline and document the result with date, operator, and instrument calibration. Retorque schedules (e.g., first check after 24–72 hours, then periodic intervals) help catch relaxation that could raise PIM over time. 4 — Case studies & compatibility (Case display) Typical deployments and performance outcomes Scenario A — Macrocell jumper: used between antenna and hybrid/metering point where durability and low PIM are required; target two‑tone PIM ≤ -150 dBc and insertion loss minimal. Scenario B — In‑building DAS link: when deployed in dense connectors, the TC‑SPO375‑DM‑LP is selected for consistent low PIM across many junctions; teams should aim for per‑jumpers PIM well below system noise floor. Scenario C — Small cell coax jumpers: compact runs benefit from low‑PIM SPO375 family to prevent intermodulation in close proximity. For each, report before/after PIM readings to document the benefit of low‑PIM connectors in the signal chain. Interoperability: mating types, adapters, and cross‑vendor compatibility TC‑SPO375‑DM‑LP is inherently a 7/16 DIN male variant; compatible mating types include 7/16 DIN female interfaces and common adapters to 4.3‑10 or N types. When mixing vendors or using adapters, perform mixed‑vendor PIM verification: even if each individual part meets datasheet PIM claims, interfaces can create nonlinearity. Recommend pre‑deployment assembly testing in a controlled lab and documenting the PIM behavior of every unique adapter + connector combination. Purchasing & lead‑time notes from distributors Source through authorized distributors to ensure traceability and warranty; avoid grey‑market parts that lack lot tracebacks and PIM test certs. Typical supplier lead times vary by variant (right‑angle, solder‑on pin, different plating) — plan procurement with buffer for long‑lead configurations. Useful search keywords for purchasing: “TC‑SPO375‑DM‑LP datasheet”, “TC‑SPO375 backorder”, and specific part family numbers to match vendor SKU nomenclature and ensure correct physical variant is ordered. 5 — Actionable recommendations for procurement, testing & maintenance (Action) Procurement checklist (what to request from supplier) Request a complete procurement packet: full datasheet, PIM test certificate specifying two‑tone conditions used, lot and serial traceability, RoHS/REACH compliance statements, warranty terms, and confirmation of authorized distributor status. Label checklist headings with the part name for clarity (e.g., TC‑SPO375‑DM‑LP specs) and require signed acceptance of mismatch resolution steps should delivered parts differ from datasheet claims. Hold purchase pending receipt of lot PIM certs where project acceptance requires verified low‑PIM performance. On‑site QA and verification protocol On‑site protocol: visual inspection → mechanical fit verification (torque and threading) → IL/VSWR sweep → two‑tone PIM test using agreed parameters (document tone powers, spacing, and instruments). Record all readings in a standardized log. Acceptance criteria example: PIM ≤ -150 dBc at +43 dBm per tone, VSWR below project threshold, and IL within specified tolerance. If out of spec, quarantine the assembly, document immediate readings, and escalate to supplier for root cause and replacement. Maintenance & monitoring to preserve low PIM over lifecycle Preventive tasks: periodic inspection (quarterly for exposed outdoor connectors, semiannual for DAS interiors), retorque schedule (initial retorque within 24–72 hours, then at planned intervals), and immediate retest after severe weather events or mechanical disturbance. Keep baseline PIM and VSWR logs to detect trends; set alarm thresholds for incremental PIM rise (e.g., 3–6 dB increase from baseline) that trigger replacement. Replace connectors showing corrosion, repeated retorque needs, or PIM drift beyond acceptance tolerances. Summary The evaluation shows that, when procured and installed per vendor recommendations, the TC‑SPO375‑DM‑LP typically meets low PIM expectations for critical cellular and DAS links. Three most important takeaways: verify datasheet PIM test conditions and torque specs before acceptance; run immediate post‑installation two‑tone PIM verification and document baselines; procure only from authorized channels with lot traceability and PIM certificates. Teams should schedule periodic PIM monitoring and enforce retorque/inspection intervals to preserve long‑term performance. Recommended CTA: obtain the manufacturer datasheet for the exact variant and perform an on‑site two‑tone verification with the specified parameters prior to final system acceptance. Additional SEO & production guidance (short) Primary keywords to include sparingly in procurement and QA pages: TC‑SPO375‑DM‑LP, low PIM, specs — use the full part string in headings and datasheet links for discoverability. Long‑tail phrases to use in metadata and product pages: TC‑SPO375‑DM‑LP datasheet, TC‑SPO375 PIM test results, 7/16 DIN low PIM connector specs, SPO375 coaxial cable low PIM performance. Visuals recommended: datasheet excerpt table, sample PIM test setup diagram, IL/VSWR sweep plots, printable procurement checklist, and a standard on‑site test log template for field teams. 6 — Frequently Asked Questions What is the expected TC‑SPO375‑DM‑LP PIM performance in field deployments? Typical field expectation for TC‑SPO375‑DM‑LP is two‑tone PIM at or below −150 dBc under standardized test conditions (commonly +43 dBm per tone, 1 MHz spacing). Actual field results depend on mating quality, torque, and environmental exposure; therefore teams should validate assembled jumpers with an immediate post‑installation two‑tone measurement to confirm the as‑deployed performance meets system acceptance criteria. How should TC‑SPO375‑DM‑LP be installed to avoid introducing low PIM issues? Installation best practices for TC‑SPO375‑DM‑LP include inspecting contacts prior to mating, using a calibrated torque wrench to the connector’s specified torque, avoiding cross‑vendor plating mismatches where possible, and performing immediate IL/VSWR and two‑tone PIM checks after installation. Proper tool selection and following supplier crimp/solder instructions eliminate common sources of micro‑movement and contact nonlinearity that cause PIM. What procurement documents should request to verify TC‑SPO375‑DM‑LP specs before purchase? Request the TC‑SPO375‑DM‑LP full datasheet, vendor PIM test certificates that list test conditions, lot traceability, RoHS/REACH compliance statements, and warranty/return policy. For critical projects, require sample assembly PIM reports or independent lab verification prior to release from hold. These documents reduce risk of receiving parts that do not meet low‑PIM system requirements.
  • TC-SPO500-NF-LP Specs Breakdown: Performance & Sourcing

    The TC-SPO500-NF-LP is a 50-ohm, low-profile, low-PIM N‑female connector engineered for demanding wireless infrastructure links. TC-SPO500-NF-LP is commonly specified where low passive intermodulation and compact form factor matter—tower jumpers, rooftop combiners, and test fixtures—providing a practical balance of RF performance and field serviceability. This data-driven brief summarizes the critical electrical, mechanical, and procurement factors procurement and engineering teams need to evaluate before acceptance and deployment. Point: Engineers require concise, measurable criteria to choose connectors for low-PIM, 50‑ohm systems. Evidence: typical US wireless projects show sustained emphasis on field-validated low-PIM components and short lead-times for high-volume rollouts. Explanation: the remainder of this breakdown translates datasheet claims into testable acceptance criteria and sourcing steps so teams can mitigate risk on procurement and installation. 1 — Background: What the TC-SPO500-NF-LP Is and Where It Fits Point: The TC-SPO500-NF-LP is positioned as a 50‑ohm, N‑female variant within the SPO‑500 family designed for low-profile mounting and low passive intermodulation (PIM). Evidence: nomenclature decodes as TC (product family), SPO500 (series/coax interface), NF (N‑female), LP (low profile). Explanation: in system architecture it typically serves as a jumper or bulkhead interface between antenna systems and coax runs, balancing compact mechanical footprint with a PIM-focused contact geometry that vendors optimize for high-power RF environments. 1.1 — Quick product snapshot and nomenclature Point: Clarify role and one-line positioning. Evidence: The TC‑SPO500‑NF‑LP is a low-profile N‑female intended for 50‑ohm SPO‑500 cable systems. Explanation: Its mechanical design shortens mating depth and reduces protrusion on panels, making it suitable for backhaul jumpers, antenna feed points, and lab test fixtures where mating cycles and low-PIM performance are required. 1.2 — Key terms and standards to know Point: Define the core RF metrics. Evidence: 50‑ohm describes characteristic impedance; PIM (passive intermodulation) measured in dBc at specified carrier levels; VSWR and insertion loss express return-loss and attenuation. Explanation: For procurement and test, acceptances often require PIM ≤ −155 dBc (two‑tone, defined power) and VSWR ≤ 1.25:1 across the intended band—these metrics must be reported with test setup details (power per tone, frequency pair, test cable references) to be meaningful. 1.3 — Closely related variants and cross-reference Point: Variants in the 500‑series alter mechanical and electrical behavior. Evidence: Examples include TC‑500‑NF‑LP (similar family, possibly different interface tolerances) and TC‑SPO500‑NM‑RA‑LP (N‑male, right‑angle, low profile). Explanation: Designers must check gender (NF vs NM), mounting style (straight vs RA), and family compatibility to ensure mating symmetry and VSWR stability; mechanical offsets and tolerances can increase VSWR or introduce PIM if mismatched. 2 — Performance Data Analysis: Measured Metrics & Benchmarks Point: Establish measurable performance expectations for electrical and mechanical acceptance. Evidence: Vendors publish VSWR, insertion loss, and PIM thresholds; labs validate under defined setups. Explanation: Procurement should demand both factory datasheet values and batch-level test reports with stated measurement conditions to compare apples-to-apples. 2.1 — RF/electrical performance metrics to evaluate Point: Key electrical targets and how to read vendor claims. Evidence: Typical acceptance thresholds used in US RF labs are: VSWR ≤ 1.20–1.30 across the working band, insertion loss ≤ 0.1 dB per connector at sub‑3 GHz ranges, and PIM ≤ −155 dBc (two tones, +43 dBm per tone) or better. Explanation: Vendors often state PIM as “ 2.2 — Mechanical & environmental performance Point: Mechanical durability and environmental tolerances determine lifecycle. Evidence: Typical specs include operating temperature ranges from −40°C to +85°C, IPX0–IP67 depending on sealing, and expected mating cycle counts (e.g., 500+ cycles for mass-market N connectors, less for low‑PIM precision variants). Explanation: Material choice and plating affect corrosion resistance and PIM stability; stainless or plated brass with silver overnickel provides a tradeoff between conductivity and wear resistance—specify finish and environmental acceptance for rooftop and coastal deployments. 2.3 — Lab vs. field performance and common failure modes Point: Recognize divergence between lab measurements and field results. Evidence: Common observed failures include degraded PIM after repeated mates, increased VSWR after corrosion or contamination, and solder joint fatigue. Explanation: Installation handling (improper torque, contaminated contacts, poor solder quality) often accounts for the majority of in-field failures—design the acceptance plan to include pre‑install inspection, post‑assembly PIM retest, and field verification to detect these issues early. ParameterTypical DatasheetMeasured Range (Field/Lab) VSWR (0.5–3 GHz)≤ 1.20:11.18–1.35 (installation dependent) Insertion Loss (per connector)≤ 0.1 dB0.05–0.2 dB PIM (two-tone, +43 dBm/tone)≤ −155 dBc−155 to −165 dBc (clean, properly torqued) Temp Range−40°C to +85°CSame Suggested test matrix (PIM, VSWR, insertion loss): a) Pre‑assembly component-level PIM@+43 dBm; b) Post‑assembly PIM and VSWR; c) Environmental stress (thermal cycle) followed by PIM/VSWR; d) Mating cycle test with periodic PIM checks. Pass/fail criteria should mirror production specs with explicit measurement setups noted. 3 — Technical Specs Deep-Dive: Drawings, Materials & Assembly (focus on specs) Point: Deep technical scrutiny of drawings, materials, and termination methods prevents downstream performance surprises. Evidence: Dimensional tolerances and materials directly affect RF continuity and PIM. Explanation: Procurement and engineering must verify mechanical drawings against panel/cable layouts and require material and plating declarations on purchase orders to ensure long-term RF stability. 3.1 — Mechanical drawings and critical dimensions Point: Identify which dimensions matter for integration. Evidence: Key dimensions include outer conductor diameter, flange footprint, mounting hole centers, and mating depth. Explanation: For panel or rack integration, tolerance stack-ups on flange thickness and mating depth can alter cable bend radius and interface pressure—specify ±0.1 mm or vendor‑stated tolerances and request CAD files (STEP/IGES) when performing mechanical integration. 3.2 — Materials, plating and RF implications Point: Material and finish choices drive conductivity, wear, and PIM. Evidence: Common conductors include brass (cost-effective), beryllium copper (spring/contact resilience), and stainless steel (mechanical strength); plating options include silver, gold, and nickel. Explanation: Silver plating typically maximizes conductivity but oxidizes; nickel underplating increases durability but can raise RF losses at higher frequencies—specify plating stack (e.g., silver over nickel) and require compatibility with SPO‑500 dielectric materials to reduce dielectric charging and PIM. 3.3 — Assembly, termination and quality control best practices Point: Best practices for solder and crimp terminations plus QC checkpoints. Evidence: Solder‑on pins should use controlled heat profiles and flux selection; crimp terminations require calibrated tooling and cross‑section inspection. Explanation: Recommended QC includes visual inspection for solder fillet quality, pull tests per specified force, continuity checks, and mandatory PIM re‑test after assembly. Sample spec-sheet checklist for authors and QC teams: material certificates, plating thickness, mating/cable compatibility, VSWR/PIM test report, lot traceability, and assembly process notes. Spec-sheet checklist for PO: part number, drawing revision, material/plating callouts, electrical limits (VSWR/PIM/IL), environmental ratings, lot test reports, and approved solder/crimp process documents. 4 — Sourcing & Procurement Guide (include TC-SPO500-NF-LP in title) Point: Practical sourcing considerations reduce schedule and performance risk. Evidence: Multiple manufacturers supply 500‑series connectors (examples in US supply chains include Pasternack, Times Microwave, AWC). Explanation: Map manufacturer part numbers to cross‑reference tables and interpret suffixes (NF = N‑female, NM = N‑male, LP = low profile, RA = right angle) so procurement can verify functional equivalence before ordering. 4.1 — Approved vendors, part-number variants and cross-references Point: Create a vetted vendor list and cross‑reference map. Evidence: Typical suppliers to check include established RF vendors and authorized distributors; compare mechanical drawings and electrical specs, not just part numbers. Explanation: When mapping cross-references, ensure plating, mating depth, and PIM test conditions match the target spec; an identical PN suffix can still mask differences in plating or insulator geometry that affect PIM. 4.2 — Lead time, MOQ, pricing benchmarks and stocking strategy Point: Balance cost, lead time, and spares for operational continuity. Evidence: Lead times vary—common RF connectors may be stocked by distributors, while low‑PIM variants can have multi‑week lead times and MOQs for plated variants. Explanation: For critical spares, maintain a minimum spare set per site (e.g., 2–3 connectors per site) and use distributor stocking for fast replacement; consider direct buys for large programs to secure lead time and price breaks. 4.3 — Compliance, traceability and counterfeit mitigation (sourcing checklist) Point: Require documentation and inspection practices to mitigate counterfeit and performance risk. Evidence: Acceptable documentation includes lot traceability, material certificates, and batch PIM/VSWR test reports. Explanation: Procurement best practices: use authenticated vendor lists, require ATP/inspection on receipt, perform sample destructive or electrical testing on new lots, and include contractual right-to-inspect clauses. RFQ template outline for procurement teams: required drawings, test report templates (PIM/VSWR), material/plating declarations, packaging/handling, lead time, MOQ, and acceptance test plan. 5 — Field Use Cases & Actionable Checklist (installation, testing, lifecycle) Point: Translate specs into field actions and checklists that reduce installation error. Evidence: Field deployments repeatedly show installation procedure and torque control materially affect PIM/VSWR performance. Explanation: Standardize pairing recommendations, pre‑installation steps, torque and solder guidelines, and commissioning tests to capture deviations before commissioning. 5.1 — Representative deployments and pairing recommendations Point: Recommended pairings and deployments. Evidence: Best results achieved when SPO‑500 connectors are mated with matching SPO‑500 cable types and compatible N connectors rated for low PIM. Explanation: Typical pairings include tower-top short jumpers with SPO‑500 low-loss cable and TC‑SPO500‑NF‑LP bulkhead; lab test fixtures should use precision adapters with known PIM floors to avoid masking DUT performance. 5.2 — Installation & commissioning checklist Point: Steps to ensure correct installation and measurable acceptance. Evidence: A robust commissioning flow includes visual inspection, solder/crimp verification, torque to vendor spec, and electrical checks (PIM, VSWR sweep, insertion loss). Explanation: Record pre/post installation PIM at defined carrier power and frequency pairs, perform a VSWR sweep across the operating band, and document acceptance thresholds and measured results in the site report. 5.3 — Maintenance, spares planning and end-of-life indicators Point: Lifecycle and replacement triggers. Evidence: Recommended inspection cadence is semi‑annual for harsh outdoor sites and annual for indoor sites; end‑of‑life signs include consistent PIM rise, degraded VSWR, visible wear or corrosion, and increased contact resistance. Explanation: Calculate spares per site based on failure history and criticality (e.g., 2–3 spares/site for critical nodes), and track lifecycle cost by replacing connectors before PIM degradation becomes service affecting. Summary The TC-SPO500-NF-LP is a practical 50‑ohm, low‑profile, low‑PIM N‑female option for antennas and jumpers; verify PIM and VSWR under defined test conditions before acceptance. Key specs to confirm on purchase: PIM threshold (dBc with test conditions), VSWR across intended band, plating/material callouts, and mating tolerances—require lot test reports and material certificates. Sourcing checklist: validate vendor cross‑references, request CAD and test reports, include ATP/inspection clauses, and keep critical spares on hand to reduce downtime for field maintenance. Commissioning and maintenance: use a documented torque/solder process, perform pre/post PIM and VSWR tests, and inspect regularly for contamination or wear to avoid latent performance losses. FAQ What are the TC-SPO500-NF-LP specs sheet items procurement should request? Procurement should request a complete specs sheet that lists electrical (VSWR, insertion loss, rated frequency band), PIM test results with explicit test setup (power per tone, frequency pair), mechanical drawings with tolerances, material and plating declarations, environmental ratings, lot traceability, and assembly/termination recommendations. Insist on batch-level test reports and the vendor’s acceptance criteria to ensure purchased lots meet the documented performance limits. How should field teams test TC-SPO500-NF-LP for low PIM performance during commissioning? Field commissioning should include two‑tone PIM testing at industry-standard power levels (commonly +43 dBm per tone) across representative frequencies, a VSWR sweep across the operating band, and insertion-loss verification. Record baseline pre‑installation and post‑installation measurements and compare against acceptance thresholds (e.g., PIM ≤ −155 dBc; VSWR ≤ 1.25:1). Re-test after environmental stress or mating cycles if concerns arise. Where to source TC-SPO500-NF-LP to minimize counterfeit and lead-time risk? Source from authorized distributors or directly from vetted manufacturers with documented traceability and production test reports. Include ATP/inspection on receipt, request material certificates and batch PIM/VSWR tests, and consider stocking critical spares through distributor consignment to shorten replenishment lead times. Avoid gray‑market buys that lack lot traceability or documented test data.
  • TC-SPO250-NF-LP: US Market Performance & Sourcing Facts

    In the past 12 months, shipments of SPO-family low-PIM coaxial assemblies (including TC-SPO250-NF-LP) to US telecom integrators rose by an estimated 18–25% as carriers accelerated densification and retrofit work for outdoor DAS and small-cell rollouts. This brief provides a focused summary of US market performance, practical sourcing realities, procurement options, and concrete next steps for engineering and procurement teams responsible for RF feed systems. It is written to support decisions on specification, vendor selection, inspection, and inventory strategies for mission-critical deployments. 1 — Product background: What TC-SPO250-NF-LP is and why it matters (background introduction) 1.1 Technical summary and typical specs Point: The TC-SPO250-NF-LP is a low-PIM coaxial assembly using an N female connector, optimized for low passive intermodulation and outdoor RF linking. Evidence: Typical manufacturer datasheets and industry catalogs for SPO/SPF/SPP cable families list key parameters: 50 Ω impedance, frequency coverage commonly from DC to several GHz (often specified to 6 GHz or higher depending on cable), PIM ratings in the range of −155 dBc or better under standard 2×20 W test conditions, and compatibility with SPO-series low-loss foam-dielectric cables. Explanation: For field performance, impedance uniformity affects return loss and VSWR; frequency range determines suitability for LTE and mid-band 5G; low-PIM prevents spurious intermodulation products in multi-carrier sites; and cable-family compatibility determines bend radius, attenuation, and outdoor ruggedness. Engineers should confirm the exact published spec sheet for the vendor part number used in procurement. 1.2 Typical use cases in US deployments Point: The assembly is selected where low PIM, manageable insertion loss, and serviceability matter. Evidence: Integrators deploy similar N-female low-PIM assemblies extensively on macro feeder tails, rooftop jumpers, outdoor DAS nodes, and temporary test rigs. Explanation: In macro cell feeders the low insertion loss across the length reduces tower-level attenuation; in DAS and in-building systems the low-PIM behavior preserves SINR when multiple carriers and carriers’ bands coexist; and in test rigs or service vehicles the N female interface and standardized torque help rapid swaps with consistent RF performance, lowering mean time to repair on critical sites. 1.3 Key differentiators vs. generic N-type assemblies Point: Compared to generic N-type assemblies, low-PIM SPO-family builds typically offer better PIM performance, more rigorous plating and sealing, and clearer traceability. Evidence: Differences show up in manufacturer control points (connector plating processes, dielectric selection, and PIM screening) and in warranty or acceptance test language in datasheets. Explanation: Buyers choose TC-SPO250-NF-LP-style assemblies when the marginal premium for improved PIM and documented QA reduces long-term OPEX risk from rework and RF issues; key selection criteria include certified PIM values, robust environmental sealing (IP67 where required), and manufacturer-backed traceability and replacement terms. 2 — US market performance: shipments, demand drivers, and regional trends (data analysis) 2.1 Recent shipment and demand metrics Point: Shipments and stock turn for low-PIM SPO-family assemblies have accelerated alongside 5G mid-band deployments and retrofit projects. Evidence: Distributor stocking data and manufacturer order books reported higher replenishment rates, and industry product guides and catalogs show expanded SPO-series listings and same-day offering trends. Explanation: Vendors report lead-time compression on common lengths but variability across custom assemblies; integrators are placing larger rolling orders with blanket POs to secure supply. Where precise shipment counts are unavailable publicly, procurement teams should treat regional distributor fill rates and quoted lead times as the best near-term indicators of supply tightness. 2.2 Demand drivers: 5G densification, retrofit projects, and outdoor DAS Point: Three principal drivers explain recent demand: 5G densification (small cells and mid-band), widespread DAS upgrades in venues and enterprise campuses, and municipal/utility retrofit projects. Evidence: Carrier build plans, municipal approvals for small-cell sites, and venue modernization programs have increased site counts needing reliable low-PIM jumpers and discrete assemblies. Explanation: Densification multiplies connection points where low-PIM performance is critical; retrofits often replace legacy assemblies with SPO-style parts to meet stricter PIM acceptance thresholds; and outdoor DAS projects, being mission-critical, favor documented assemblies to minimize acceptance testing cycles and site churn. 2.3 Regional & vertical concentration Point: Demand is concentrated in dense urban corridors and verticals with high-capacity requirements. Evidence: Regions with major stadiums, convention centers, dense CBDs and university or healthcare campuses have higher recurring orders; procurement channels in these regions show faster SKU turnover. Explanation: Stadiums, healthcare campuses, airports, and enterprise campuses represent verticals where continuous high throughput and multi-operator DAS drive strict acceptance criteria; buying patterns favor authorized distributors that can guarantee traceability and timely QA support for on-site acceptance testing. 3 — Sourcing & supply-chain practical guide for TC-SPO250-NF-LP (method/guideline) 3.1 Approved suppliers, OEM vs. authorized distributors Point: Choose suppliers by risk profile: OEMs (direct), authorized distributors, or contract manufacturers. Evidence: Approved-vendor lists typically include original manufacturers and a short list of authorized distributors; grey-market listings exist in secondary channels and should be treated cautiously. Explanation: OEMs provide the strongest traceability and warranty; authorized distributors provide faster shipping and stocked variants; contract manufacturers offer volume customization but require tighter QA clauses. Verify authenticity by matching vendor lot codes to manufacturer records, requesting batch test reports, and confirming warranty language. For contract risk mitigation, require serialization or labeling that links to manufacturer certification. 3.2 Lead times, MOQ, pricing drivers, and stock strategies Point: Typical lead times vary by stock status—common lengths may ship in days while custom assemblies can take multiple weeks. Evidence: Distributors often show same-day options for catalog lengths, while made-to-order assemblies reflect the manufacturer's production queue. Explanation: MOQ and pricing scale with assembly complexity and volume; common tactics to mitigate shortages include safety stock (turns-based buffer), consignment agreements with local distributors, and blanket POs with release schedules. For high-usage SKUs, negotiate tiered pricing and a firm-fill commitment in the contract to cap escalation and improve predictability for rollout timelines. 3.3 Quality checks and incoming inspection checklist (sourcing-specific) Point: Implement a concise incoming inspection focusing on PIM, return loss, mechanical fit, and traceability. Evidence: Best-practice QA checklists used by integrators include a PIM test (2×20 W), insertion loss and return-loss spot checks, connector torque and visual plating inspection, and label/lot code verification. Explanation: Practical acceptance steps: (1) verify part number and lot code against PO; (2) perform visual inspection for plating and sealing; (3) torque check to specified value; (4) sample PIM and return-loss test per test-plan; (5) document results and quarantine failures. Maintain a written “TC-SPO250-NF-LP low-PIM testing checklist” in the project QA pack to standardize site acceptance. 4 — Comparative analysis & supplier case examples (case study / data analysis) 4.1 Vendor comparison (feature, price, availability) Point: Use a simple comparison matrix to balance feature set, price, and availability with TC-SPO250-NF-LP as baseline. Evidence: Vendor datasheets and distributor price sheets typically list PIM spec, warranty, and available lengths; same-day distributors may show higher per-unit price but lower lead-time risk. Explanation: The recommended framework: columnar comparison for PIM spec (dBc), return loss at key bands, plating finish, lead-time, SKU availability, and warranty. Choose suppliers where PIM spec and documented QA are in line with acceptance criteria; accept modest price premiums to secure shorter lead times for critical deployments. 4.2 Field case: rapid deployment scenario (example) Point: A US integrator deployed a stadium DAS using SPO-family assemblies on a compressed schedule by combining distributor stock and expedited OEM runs. Evidence: Timeline highlights: PO placement, sample QA, bulk release, and staged site installs with consigned spares. Explanation: The integrator pre-qualified a distributor for same-day stock of standard lengths, placed a blanket PO for custom lengths with a manufacturer, and deployed a rotation of pre-tested jumpers. QA included a pre-shipment PIM sweep, and the deployment met acceptance thresholds with zero rework due to upfront testing and clear traceability. 4.3 Risk scenarios: counterfeit/grey-market and mitigation Point: Counterfeit and grey-market risk is real where demand outstrips supply. Evidence: Red flags include unusually low pricing, missing lot codes, inconsistent labeling, or lack of test documentation. Explanation: Mitigation steps: mandate authorized distributor sourcing in contracts, require manufacturer-authenticated lot verification, include hold-back payment terms pending QA results, and insert rejection and replacement clauses for non-conforming parts. For high-risk purchases, require serialized parts and a certificate of conformity from the OEM. 5 — Procurement & deployment checklist: immediate actions for US buyers (action recommendations) 5.1 Pre-purchase checklist (spec sign-off & test plan) Point: Verify exact part number, orientation, PIM and frequency specs, and acceptance criteria before PO. Evidence: Effective pre-purchase lists used by procurement teams include part number confirmation, connector gender/orientation, allowable insertion loss, and explicit PIM acceptance levels. Explanation: A defensible spec sign-off requires a written test plan referencing sample sizes, PIM test conditions, return-loss thresholds, and torque values; include acceptance gates for incoming inspection and site acceptance to avoid ambiguity during installation. 5.2 Contracting and logistics best practices Point: Insist on warranty language, SLA for delivery, and clear Incoterms. Evidence: Contract clauses for RF assemblies commonly include warranty duration, remedies for non-conforming material, and delivery SLAs. Explanation: Recommended terms: 12–24 month limited warranty, penalties or credits for missed delivery SLAs on critical orders, holdback of a portion of payment until QA completion, and clear Incoterms (DAP or DDP) to control delivery risk for US sites. Include language that requires manufacturer traceability and certificates of conformity on shipment. 5.3 Post-delivery steps and maintenance tips Point: Standardize installation torque, periodic PIM spot checks, and spare-part stocking rules. Evidence: Field guidance includes mounting and torque specs from connector manufacturers, scheduled PIM checks after large maintenance windows, and keeping a 5–10% spare buffer on critical sites. Explanation: Practical post-delivery rules: document torque values in site folders, use calibrated torque wrenches, schedule PIM spot-checks after major weather events or RF changes, and maintain critical spare lengths in a local consignment to reduce MTTR. Summary TC-SPO250-NF-LP is a proven low-PIM coaxial assembly suited for US market densification projects; procurement should balance certified PIM performance with supply predictability and documented QA. Sourcing: prefer OEM or authorized distributors, require lot traceability and a written TC-SPO250-NF-LP low-PIM testing checklist to reduce counterfeit risk and acceptance delays. Inventory and contracting: use safety stock, blanket POs, and delivery SLAs to manage TC-SPO250-NF-LP lead time US concerns and maintain deployment schedules. QA and field practice: enforce incoming PIM/return-loss checks, torque verification, and scheduled maintenance to protect service levels in high-demand verticals. Frequently Asked Questions What are the typical lead times for TC-SPO250-NF-LP in the US market? Lead times vary by configuration and stock status: catalog lengths from authorized distributors may ship same-day to a few days, while custom lengths from OEMs often require multiple weeks. Procurement teams should request current lead-time quotes, negotiate blanket orders for scheduled releases, and maintain a safety-stock policy to bridge production gaps. How should buyers verify TC-SPO250-NF-LP quality on receipt? Implement a short incoming inspection: confirm part number and lot code, perform visual plating and seal check, verify connector torque and mechanical fit, and run sample PIM and return-loss tests per the project test plan. Quarantine non-conforming lots and require immediate corrective action from the supplier. What contracting terms reduce sourcing risk for critical TC-SPO250-NF-LP orders? Include manufacturer traceability requirements, certificates of conformity, delivery SLAs with remedies, payment hold-backs until QA completion, and an explicit warranty for replacement of non-conforming components. For high-volume programs, negotiate consignment or vendor-managed inventory to secure continuity.