


Helping you save cost and time.

Provide reliable packaging for your goods.

Quick and reliable delivery to save time.

Excellent after-sales service.
New Product Launch
More +


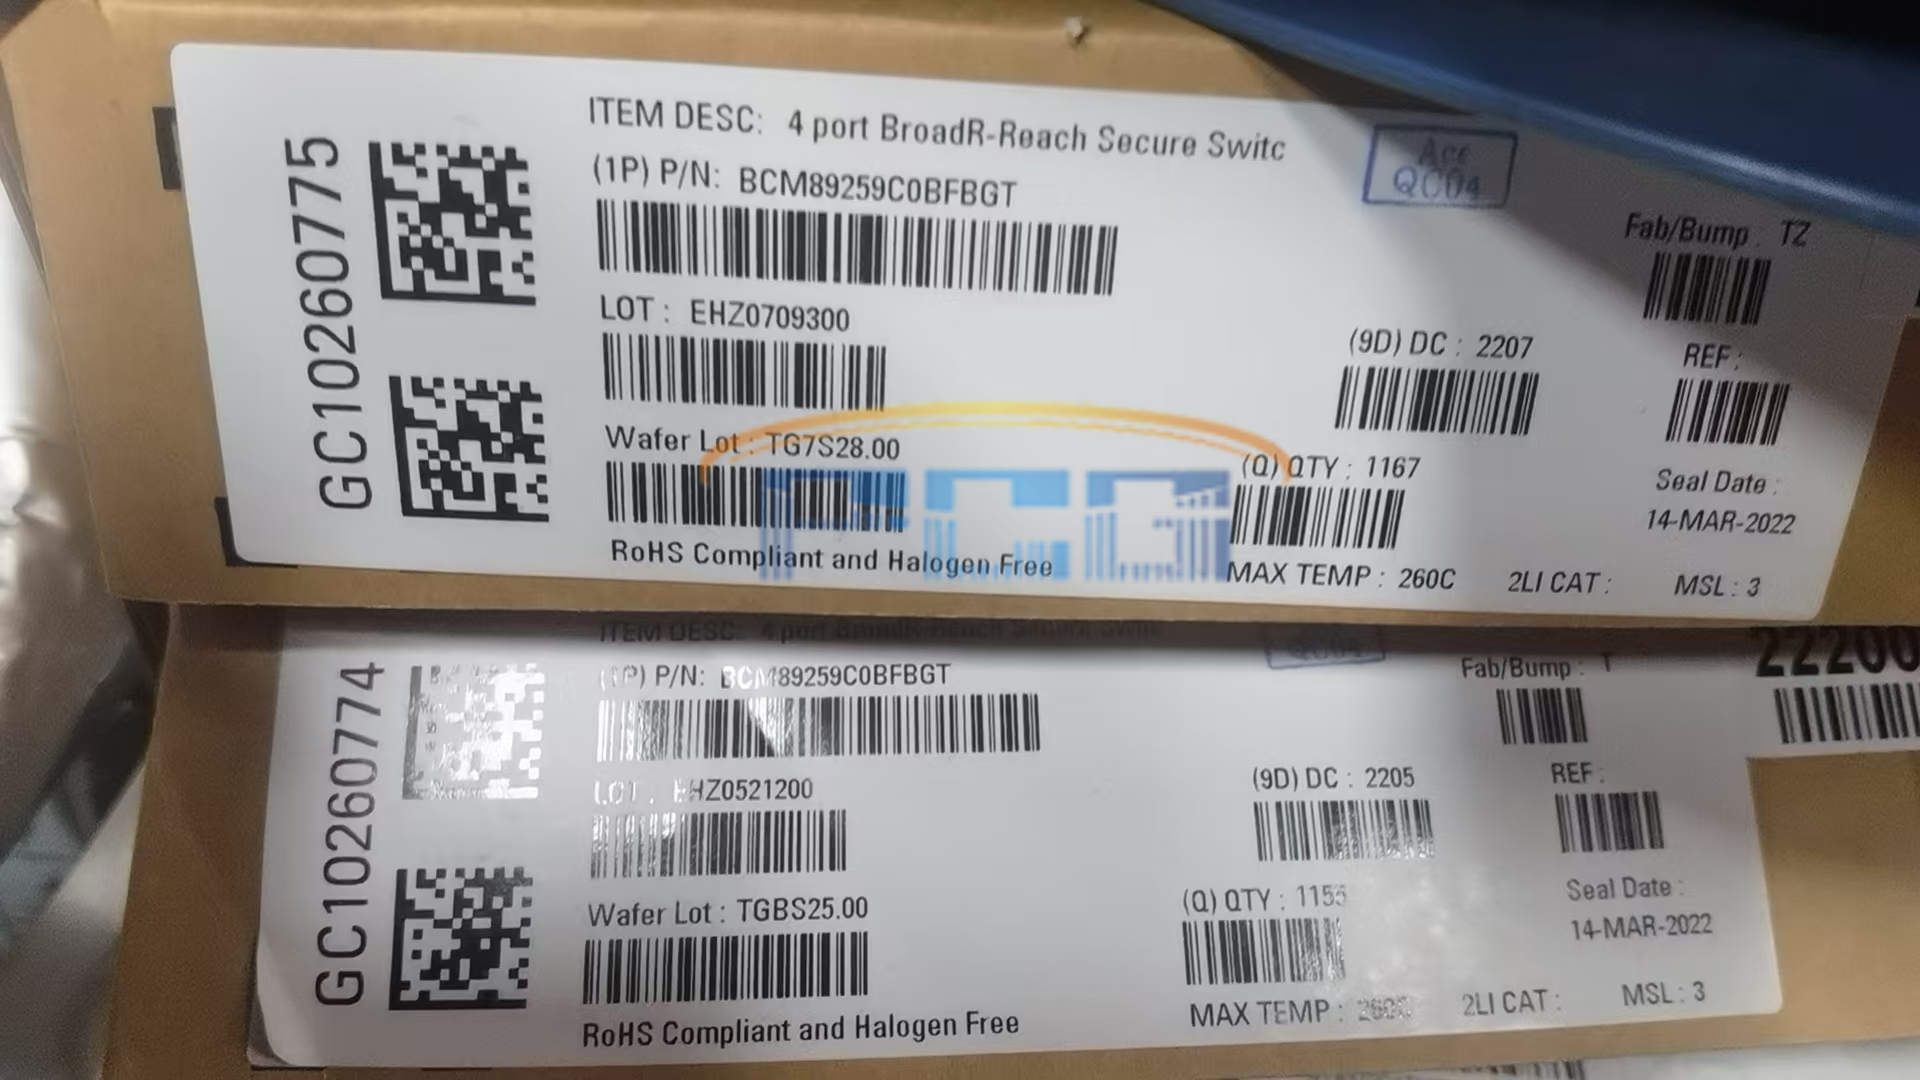
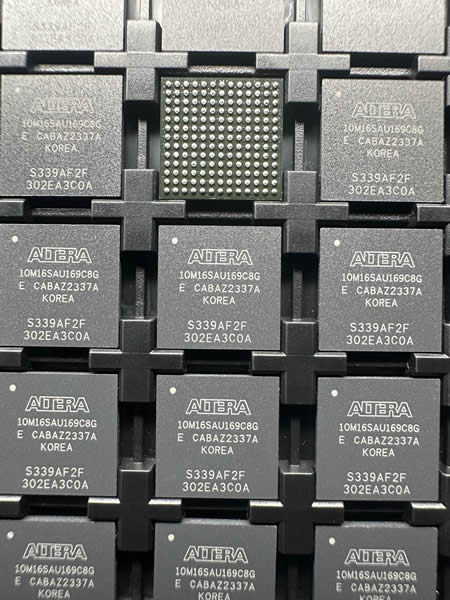
Hot Selling Parts


| Manufacturer | Part Number | Price |
|---|---|---|
| BCM89259C0BFBGT | USD $0 | |
| 10M16SAU169C8G | USD $0 | |
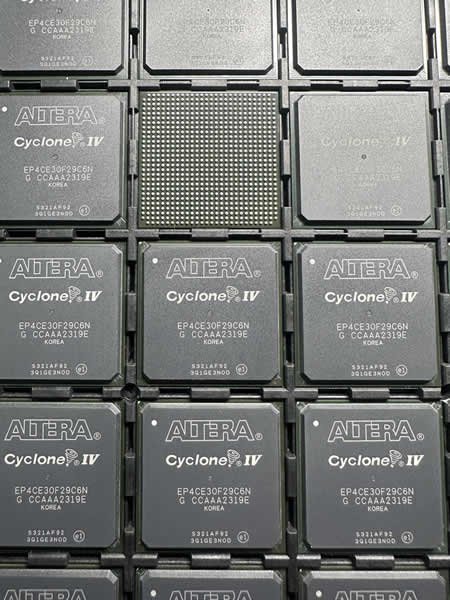
| EP4CE30F29C6N | USD $0 | |
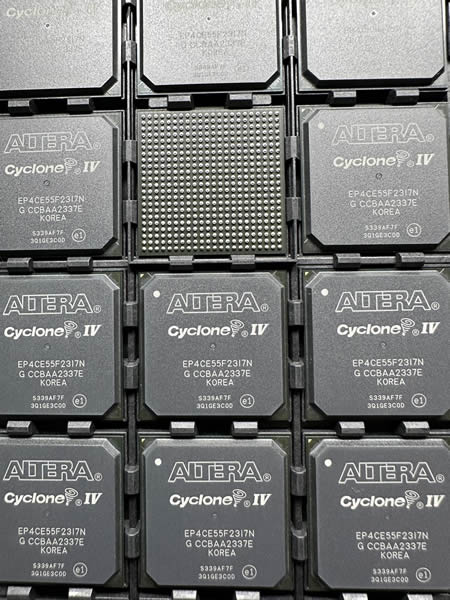
| EP4CE55F23I7N | USD $0 | |
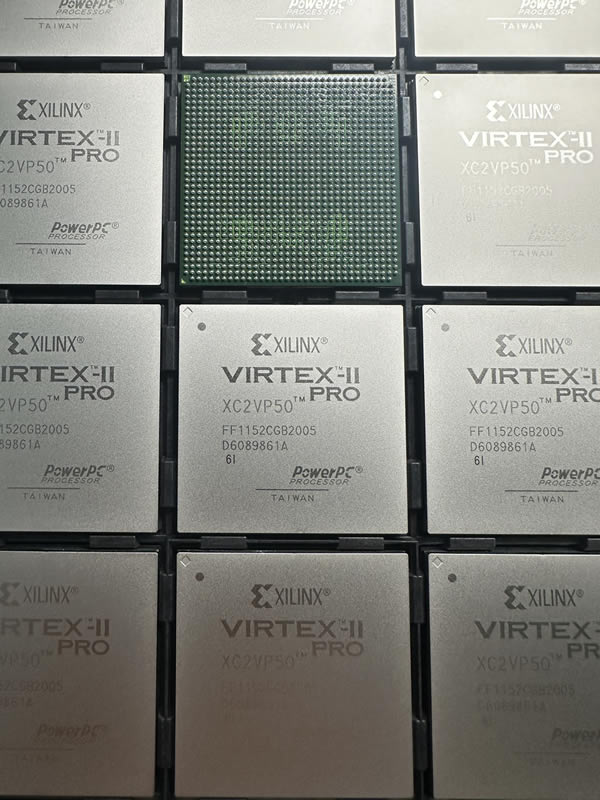
| XC2VP50-6FFG1152I | USD $0 | |
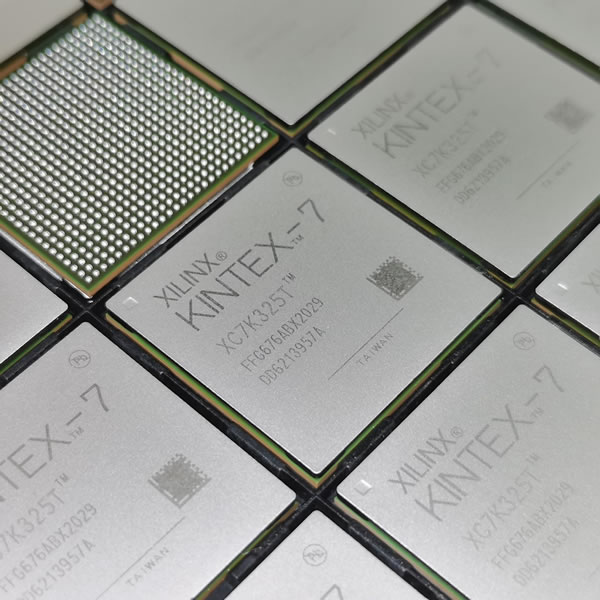
| XC7K325T-2FFG676I | USD $0 | |
| XC7VX690T-1FFG1157I | USD $0 | |
| XCVU9P-2FLGA2104I | USD $0 |
Blog

414046-2: How to Verify Pinout, Footprint & Soldering Tips
Incorrect pin mapping, an inaccurate PCB footprint, or poor soldering on a small RF/coaxial connector can cause intermittent signals, mechanical failure, or board scrap. This guide provides concise, t…

413586-1 Cross-Reference Guide: Replace Grease Safely
Background: Understanding 413586-1 Specifications Definition and Application Scope 413586-1 is a part/specification designation used in maintenance documentation to identify a required grease formulat…
1052720-1: How to Replace Discontinued RF Connectors
2026-01-21 12:36:59
2-329063-1 BNC Connector Specs: Performance Report
2026-01-21 12:36:55
1086755-1 Battery Report: Complete ID & Specs Reference
2026-01-20 12:34:56
2-1393757-0 RF Coax Connector Datasheet: Key Specs & Data
2026-01-20 12:34:52
4-1393682-7 75Ω Coaxial Jack: Measured Specs & Mounting
2026-01-19 11:15:16
Read more